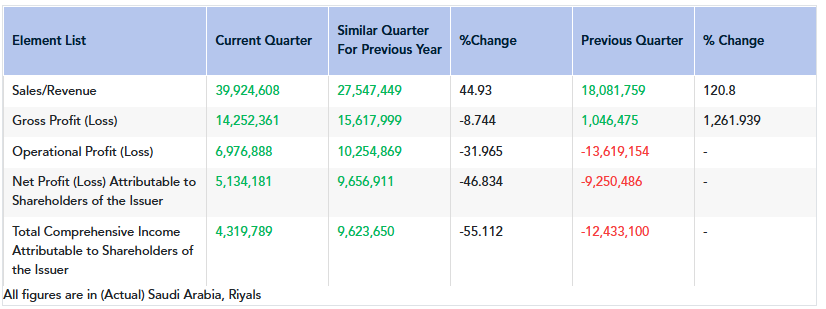
Jazan Development and Investment Co. announces its Interim Financial results for the Period Ending on 2026-03-31 ( Three Months )
| Element List | Current Period | Similar period for previous year | %Change |
|---|---|---|---|
| Total Shareholders Equity (after Deducting Minority Equity) | 314,049,681 | 319,253,700 | -1.63 |
| Profit (Loss) per Share | 0.1 | 0.19 | |
| All figures are in (Actual) Saudi Arabia, Riyals | |||
| Element List | Amount | Percentage of the capital (%) | |
|---|---|---|---|
| Profit (Losses) Resulting From The Change In Investment Propertie’s Fair Value | - | - | |
| Accumulated Losses | -125,659,796 | -25.13 | |
| All figures are in (Actual) Saudi Arabia, Riyals | |||
| Element List | Explanation |
|---|---|
| The reason of the increase (decrease) in the sales/ revenues during the current quarter compared to the same quarter of the last year is | The reason for the increase in sales/revenues during the current quarter compared to the same quarter of the previous year is Primarily due to the increase in shrimp sales, which increased to SAR 35.04 million in Q1 2026 compared to SAR 23.54 million in Q1 2025, representing an increase of 48.8%. |
| The reason of the increase (decrease) in the net profit during the current quarter compared to the same quarter of the last year is | The reason for the decrease in net profit during the current quarter compared to the same quarter of the previous is mainly due to the following:
1. Decrease in fair value gains, as they amounted to SAR 8.61 million from the revaluation of biological assets in accordance with IAS 41, compared to SAR 11.94 million in the same quarter of the previous year. 2. The comparative quarter of 2025 included a one-off gain of SAR 1.25 million from the sale of assets held for sale related to the water plant, while no similar gain occurred during the current quarter. 3. Increase in selling, marketing, and general and administrative expenses during the current quarter compared to the same quarter of the previous year. |
| The reason of the increase (decrease) in the sales/ revenues during the current quarter compared to the previous one is | The reason for the increase in sales/revenue during the current quarter compared to the previous quarter is mainly due to the seasonal nature of the shrimp production cycle, as the previous quarter was mainly a culture period, while the current quarter was a harvest period. Accordingly, shrimp sales increased to SAR 35.04 million during the current quarter compared to SAR 13.90 million in the previous quarter, supported by improved production availability and better market conditions. |
| The reason of the increase (decrease) in the net profit (loss) during the current quarter compared to the previous one is | Reasons for the increase in net profit during the current quarter compared to the previous quarter:
1. Shrimp harvesting commenced during the current quarter, which improved production availability, cost absorption, and profitability compared to the previous quarter, where limited production activity resulted in certain period costs being expensed without sufficient production to absorb them.
2. Both domestic and international markets recorded improved pricing during the quarter. |
| Statement of the type of external auditor's report | Unmodified conclusion |
| Comment mentioned in the external auditor’s report, mentioned in any of the following paragraphs (other matter, conservation, notice, disclaimer of opinion, or adverse opinion) | Material Uncertainty Related to Going Concern
We draw attention to Note (3) to the accompanying condensed interim consolidated financial statements, which indicates that the Group’s accumulated losses as at 31 March 2026 amounted to SAR 125.66 million. As of that date, the Group’s current liabilities exceeded its current assets by SAR 104.67 million, which raises a substantial doubt about the Group's ability to continue its operations as a going concern. The Group primarily relies on its ability to achieve its business plans to generate sufficient cash flow, enabling it to meet its obligations as they fall due without a significant reduction in its operations. The accompanying condensed interim consolidated financial statements have been prepared on a going concern basis. Our conclusion has not been modified in this regard. |
| Reclassification of Comparison Items | 1. Certain figures of comparative period have been reclassified to conform with the current period’s presentation it is worth mentioning that, in accordance with IFRS 5 – Non-current Assets Held for Sale and Discontinued Operations, following the closure of the water factory, the assets were reclassified as "held for sale". Consequently, the operations were divided between continuing and discontinued operations, reflecting the requirements of IFRS 5 to separate and disclose discontinued operations and assets held for sale in the financial statements.
2. The Company reclassified the comparative period line item "Other Income, net" from within operating activities to below the operating profit/loss) line under "Other Income and Expenses." |
| Additional Information | The accumulated losses of the Company as of 31 December 2025 decreased from SAR 130,86 million, representing 26.17% of the Company’s share capital of SAR 500 million, to SAR 125.66 million, representing 25.13% of the Company’s share capital of SAR 500 million. This decrease is attributed to the profits achieved during Q1 2026. |