The Kingdom of Saudi Arabia's flag
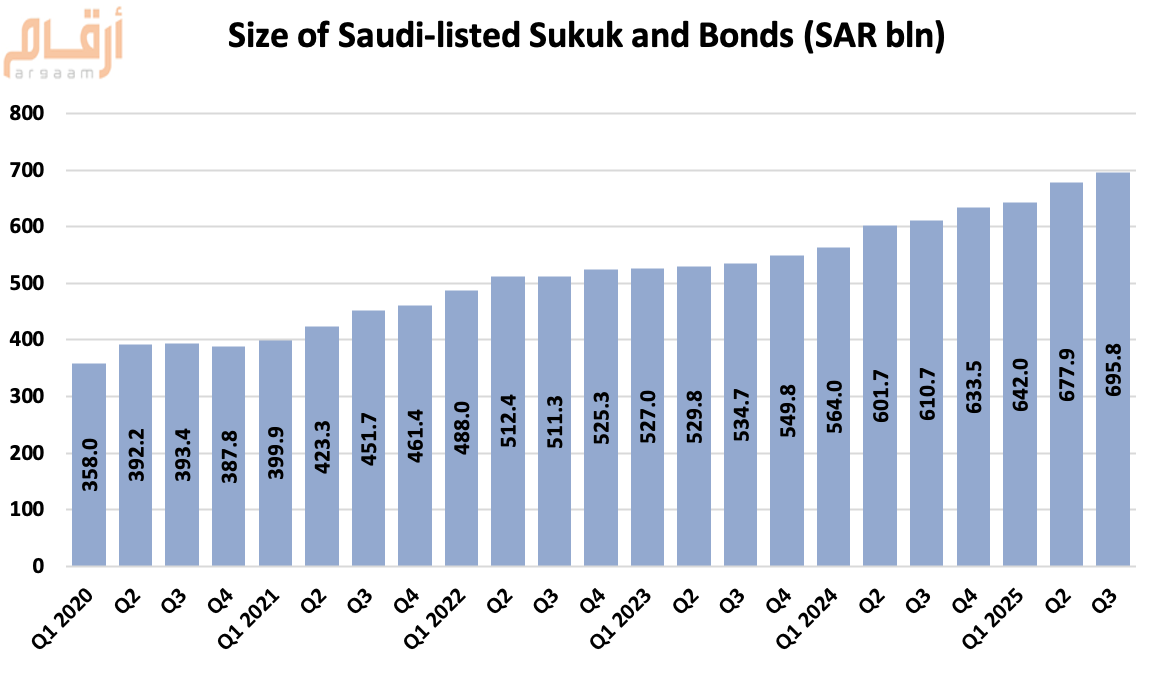
The total value of Saudi-listed sukuk and bonds rose to SAR 695.8 billion at the end of Q3 2025, up 3% quarter-on-quarter (QoQ), according to Tadawul’s quarterly debt market report.
Traded value dropped 89% to SAR 1.78 billion from SAR 16 billion in Q2.
Executed trades totaled 10,414, compared to 12,251 in Q2.
The number of listed sukuk/bond issuances stood at 60, down from 61 in Q2 2025.
Listed sukuk/bonds as a share of GDP edged up to 18.4% from 18.2% in Q2 2025.
|
Listed Sukuk/Bond Size |
|||
|
Period |
Value (SAR bln) |
QoQ Change (SAR bln) |
QoQ Change |
|
Q1 2020 |
358.0 |
-- |
-- |
|
Q2 |
392.2 |
+ 34.2 |
+10% |
|
Q3 |
393.4 |
+ 1.2 |
+0.3% |
|
Q4 |
387.8 |
(5.6) |
(1%) |
|
Q1 2021 |
399.9 |
+ 12.1 |
+3% |
|
Q2 |
423.3 |
+ 23.3 |
+6% |
|
Q3 |
451.7 |
+ 28.5 |
+7% |
|
Q4 |
461.4 |
+ 9.7 |
+2% |
|
Q1 2022 |
488.0 |
+ 26.6 |
+6% |
|
Q2 |
512.4 |
+ 24.4 |
+5% |
|
Q3 |
511.3 |
(1.1) |
(0.2%) |
|
Q4 |
525.3 |
+ 14.1 |
+3% |
|
Q1 2023 |
527.0 |
+ 1.6 |
+0.3% |
|
Q2 |
529.8 |
+ 2.8 |
+1% |
|
Q3 |
534.7 |
+ 5.0 |
+1% |
|
Q4 |
549.8 |
+ 15.1 |
+3% |
|
Q1 2024 |
564.0 |
+ 14.2 |
+3% |
|
Q2 |
601.7 |
+ 37.7 |
+7% |
|
Q3 |
610.7 |
+ 9.0 |
+1% |
|
Q4 |
633.5 |
+ 22.8 |
+4% |
|
Q1 2025 |
642.0 |
+ 8.5 |
+1% |
|
Q2 |
677.9 |
+ 35.9 |
+6% |
|
Q3 |
695.8 |
+ 17.9 |
+3% |

Government sukuk and bonds accounted for 97.6% of total listed debt at end-period, reaching SAR 679.1 billion.
Corporate sukuk and bonds made up the remaining 2.4%, or SAR 16.7 billion.
|
Details of Listed Sukuk/Bonds: |
||||
|
Period |
Govt Sukuk & Bonds |
Corporate Sukuk & Bonds |
||
|
Value (SAR bln) |
% of Total |
Value (SAR bln) |
% of Total |
|
|
Q1 2020 |
334.9 |
93.5 % |
23.1 |
% 6.5 |
|
Q2 |
369.6 |
94.2 % |
22.6 |
% 5.8 |
|
Q3 |
370.8 |
94.2 % |
22.6 |
% 5.8 |
|
Q4 |
365.7 |
94.3 % |
22.1 |
% 5.7 |
|
Q1 2021 |
377.8 |
4.5 % |
22.1 |
% 5.5 |
|
Q2 |
401.3 |
94.8 % |
22.0 |
% 5.2 |
|
Q3 |
429.7 |
95.1 % |
22.0 |
% 4.9 |
|
Q4 |
439.8 |
95.3 % |
21.6 |
% 4.7 |
|
Q1 2022 |
466.4 |
95.6 % |
21.6 |
% 4.4 |
|
Q2 |
496.8 |
97.0 % |
15.6 |
% 3.0 |
|
Q3 |
499.6 |
97.7 % |
11.7 |
% 2.3 |
|
Q4 |
503.9 |
95.9 % |
21.4 |
% 4.1 |
|
Q1 2023 |
505.6 |
95.9 % |
21.4 |
% 4.1 |
|
Q2 |
509.7 |
96.2 % |
20.0 |
3.8 % |
|
Q3 |
514.7 |
96.3 % |
20.0 |
3.7 % |
|
Q4 |
529.8 |
96.4 % |
20.0 |
3.6 % |
|
Q1 2024 |
547.4 |
97.1 % |
16.5 |
2.9 % |
|
Q2 |
585.2 |
97.2 % |
16.5 |
2.7 % |
|
Q3 |
594.2 |
97.3 % |
16.5 |
2.7 % |
|
Q4 |
617.0 |
97.4 % |
16.5 |
2.6 % |
|
Q1 2025 |
625.4 |
97.4 % |
16.6 |
2.6 % |
|
Q2 |
661.2 |
97.5 % |
16.7 |
2.5 % |
|
Q3 |
679.1 |
97.6 % |
16.7 |
2.4 % |
Saudi holdings of listed debt instruments totaled SAR 677.4 billion at the end of Q3 2025, representing 97.4% of the total.
On the other hand, foreign investors held about SAR 15 billion, while GCC investors owned SAR 3.4 billion.
|
Holdings by Nationality |
||
|
Nationality |
Value (SAR bln) |
% of Total |
|
Saudis |
677.39 |
97.4 % |
|
Foreign Investors |
15.01 |
2.2 % |
|
GCC Investors |
3.36 |
0.5 % |
|
Total |
695.76 |
100 % |
Be the first to comment


Comments Analysis: