The market capitalization of the Saudi Stock Exchange (Tadawul) inched lower 0.15% to about SAR 9.25 trillion in the week ending Dec. 3, 2020, compared to a week earlier, according to data issued by Tadawul.
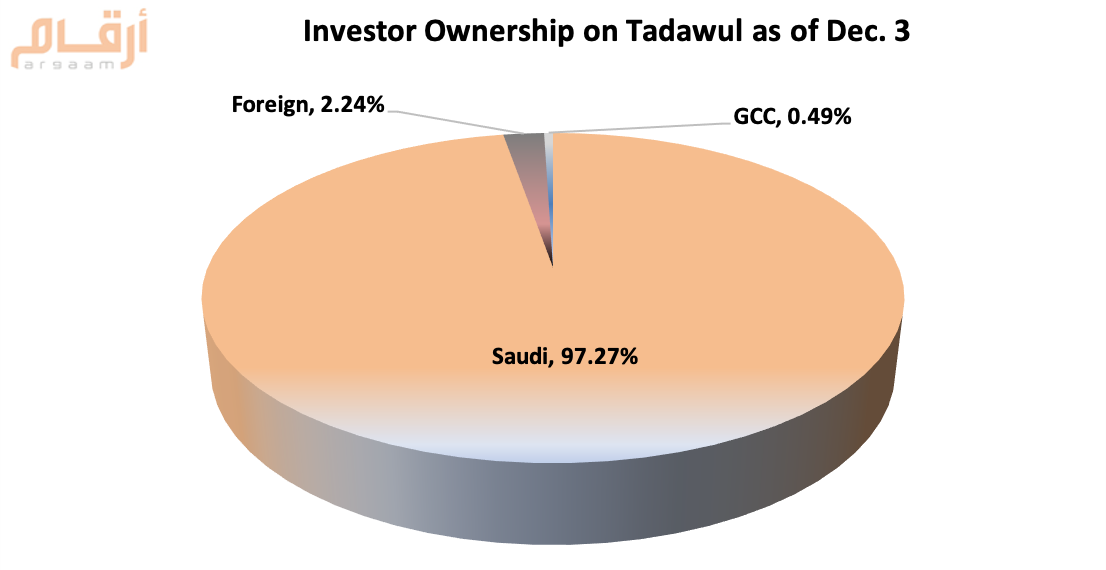
Foreign investors' ownership accounted for 2.24% of the total market capital.
|
Ownership Value by Nationality and Investor Type - (SAR bln) |
||||
|
Investor Type |
November 26 |
December 3 |
Variation |
|
|
Saudi Investors |
Retail |
128.2 |
126.4 |
(1.8) |
|
High Net Worth Investors |
181.8 |
184.2 |
+2.4 |
|
|
Individual Professional Investors |
296.9 |
298.8 |
+1.9 |
|
|
Individual DPMs |
6.2 |
6.2 |
-- |
|
|
Total (retail) |
613.1 |
615.6 |
+2.5 |
|
|
Corporate |
621.5 |
620.4 |
(1.1) |
|
|
Mutual Funds |
211.9 |
210.9 |
(1.0) |
|
|
Government Related Entities |
7514.7 |
7503.8 |
(10.9) |
|
|
Institutional DPMs |
51.1 |
51.2 |
+0.1% |
|
|
Total (Corporate Investors) |
8399.2 |
8386.3 |
(12.9) |
|
|
Total (Saudi investors) |
9012.3 |
9001.9 |
(10.4) |
|
|
GCC Investors |
Individuals |
2.6 |
2.6 |
-- |
|
Institutions |
42.6 |
42.6 |
-- |
|
|
DPMs* |
0.3 |
0.3 |
-- |
|
|
Total (GCC investors) |
45.4 |
45.4 |
-- |
|
|
Foreign Investors |
SWAP Holders |
2.1 |
2.1 |
-- |
|
Foreign Resident |
8.2 |
6.4 |
(1.8) |
|
|
QFIs |
158.4 |
157.7 |
(0.7) |
|
|
DPMs* |
1.1 |
1.0 |
(0.1) |
|
|
Strategic Partners |
40.5 |
40.2 |
(0.3) |
|
|
Total (foreign investors) |
210.2 |
207.2 |
(3.0) |
|
|
Total |
9268.0 |
9254.5 |
(13.5) |
|
*Undeposited shares of Amiantit - capital decrease - not included in equity as on Dec. 3
|
Ownership Ratio by Nationality and Investor Type |
||||||||
|
Investor Type |
November 26 |
December 3 |
Variation |
|||||
|
Issued Shares |
Free Float |
Issued Shares |
Free Float |
Issued Shares |
Free Float |
|||
|
Saudi Investors |
Retail |
1.38% |
9.85% |
1.37% |
9.76% |
(0.02%) |
(0.09%) |
|
|
High Net Worth Investors |
1.96% |
13.80% |
1.99% |
14.01% |
0.03% |
0.21% |
||
|
Individual Professional Investors |
3.20% |
16.65% |
3.23% |
16.77% |
0.02% |
0.12% |
||
|
Individual DPMs |
0.07% |
0.48% |
0.07% |
0.48% |
-- |
-- |
||
|
Total (retail) |
6.62% |
40.77% |
6.65% |
41.02% |
0.04% |
0.24% |
||
|
Corporate |
6.71% |
22.36% |
6.70% |
22.29% |
(0.01%) |
(0.07%) |
||
|
Mutual Funds |
2.29% |
11.06% |
2.28% |
11.04% |
(0.01%) |
(0.02%) |
||
|
Government Related Entities |
81.08% |
6.52% |
81.08% |
6.52% |
-- |
-- |
||
|
Institutional DPMs |
0.55% |
3.93% |
0.55% |
3.94% |
-- |
0.01% |
||
|
Total (Corporate Investors) |
90.63% |
43.87% |
90.62% |
43.79% |
(0.01%) |
(0.08%) |
||
|
Total (Saudi investors) |
97.24% |
84.64% |
97.27% |
84.81% |
0.03% |
0.17% |
||
|
GCC Investors |
Individuals |
0.03% |
0.20% |
0.03% |
0.20% |
-- |
-- |
|
|
Institutions |
0.46% |
2.26% |
0.46% |
2.28% |
-- |
0.02% |
||
|
DPMs* |
-- |
0.02% |
-- |
0.02% |
-- |
-- |
||
|
Total (GCC investors) |
0.49% |
2.48% |
0.49% |
2.49% |
-- |
0.01% |
||
|
Foreign Investors |
SWAP Holders |
0.02% |
0.16% |
0.02% |
0.16% |
-- |
-- |
|
|
Foreign Resident |
0.09% |
0.49% |
0.07% |
0.36% |
(0.02%) |
(0.14%) |
||
|
QFIs |
1.71% |
12.15% |
1.70% |
12.11% |
(0.01%) |
(0.04%) |
||
|
DPMs* |
0.01% |
0.08% |
0.01% |
0.07% |
-- |
(0.01%) |
||
|
Strategic Partners |
0.44% |
-- |
0.43% |
-- |
-- |
-- |
||
|
Total (foreign investors) |
2.27% |
12.88% |
2.24% |
12.70% |
(0.03%) |
(0.18%) |
||
|
Ownership’s Value & Ratio by Investor Type (SAR bln) |
|||||||
|
Investor Type |
November 26 |
December 3 |
Change in Ownership |
||||
|
Equity |
Issued Shares |
Free Float |
Equity |
Issued Shares |
Free Float |
||
|
Institutional |
8949.0 |
96.54% |
75.66% |
8936.7 |
96.55% |
75.68% |
(12.3) |
|
Non- Institutional |
319.0 |
3.46 % |
24.34 % |
317.8 |
3.45 % |
24.32 % |
(1.2) |
|
Total |
9268.0 |
100% |
100% |
9254.5 |
100% |
100% |
(13.5) |


Comments {{getCommentCount()}}
Be the first to comment
رد{{comment.DisplayName}} على {{getCommenterName(comment.ParentThreadID)}}
{{comment.DisplayName}}
{{comment.ElapsedTime}}