

-
 Bank Ranking
Banks Ratios
Cement Statistics
Cement Ranking
Cement Ratios
Monetary and Economic Statistics
Oil, Gas and Fuel
Macro Economy
Consumer Spending
Inflation
Exports & Imports
Food Prices
Non Food Prices
Construction Materials
Petrochem. Ranking
Petrochem. Ratios
Retail Rankings
Retail Ratios
Grocery Ranking
Grocery Ratios
Top Growth
Dividend History
Bank Ranking
Banks Ratios
Cement Statistics
Cement Ranking
Cement Ratios
Monetary and Economic Statistics
Oil, Gas and Fuel
Macro Economy
Consumer Spending
Inflation
Exports & Imports
Food Prices
Non Food Prices
Construction Materials
Petrochem. Ranking
Petrochem. Ratios
Retail Rankings
Retail Ratios
Grocery Ranking
Grocery Ratios
Top Growth
Dividend History
Tadawul's weekly market cap surpasses SAR 9.3T; foreign ownership at 4.83%

Content Summary: 
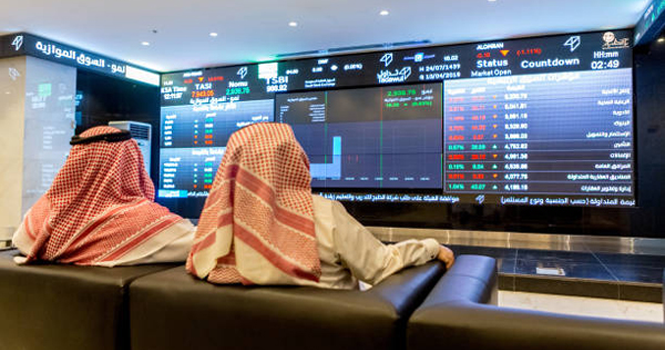 Tadawul trading screen
The market capitalization of the Saudi Exchange (Tadawul) rose 2.12%, or SAR 194.1 billion, week-on-week (WoW) to about SAR 9.352 trillion in the week ended Jan. 22, according to data issued by Tadawul.
Foreign investors' ownership accounted for 4.83% of the total market capital.
|
Ownership Value by Nationality & Investor Type (SAR bln) |
||||
|
Investor Type |
Jan. 15, 2026 |
Jan. 22, 2026 |
Change |
|
|
Saudi Investors |
Retail |
148.57 |
152.63 |
4.07 |
|
High-Net-Worth Investors |
250.18 |
257.24 |
7.06 |
|
|
Individual Professional Investors |
445.75 |
458.74 |
12.99 |
|
|
Individual DPMs |
16.56 |
17.11 |
0.55 |
|
|
Total (Retail) |
861.05 |
885.71 |
24.67 |
|
|
Corporates |
1536.46 |
1572.23 |
35.78 |
|
|
Mutual Funds |
278.78 |
286.01 |
7.23 |
|
|
Government Entities |
5903.50 |
6008.83 |
105.33 |
|
|
Institutional DPMs |
69.09 |
71.41 |
2.32 |
|
|
Total (Corporate Investors) |
7787.83 |
7938.48 |
150.65 |
|
|
Total (Saudi Investors) |
8648.88 |
8824.20 |
175.32 |
|
|
GCC Investors |
Individuals |
4.79 |
4.92 |
0.13 |
|
Institutions |
65.74 |
68.34 |
2.60 |
|
|
DPMs |
3.60 |
3.75 |
0.15 |
|
|
Total (GCC Investors) |
74.14 |
77.02 |
2.87 |
|
|
Foreign Investors |
SWAP Holders |
2.29 |
2.36 |
0.07 |
|
Foreign Residents |
19.47 |
19.61 |
0.14 |
|
|
Qualified Investors |
354.19 |
365.91 |
11.73 |
|
|
DPMs |
13.64 |
15.31 |
1.67 |
|
|
Strategic Partners |
46.22 |
48.56 |
2.34 |
|
|
Total (Foreign Investors) |
435.80 |
451.76 |
15.95 |
|
|
9158.82 |
9352.97 |
194.15 |
||
|
Ownership Ratio by Nationality & Investor Type* |
|||||||
|
Investor Type |
Jan. 15, 2026 |
Jan. 22, 2026 |
Change |
||||
|
Issued Shares |
Free Float |
Issued Shares |
Free Float |
Issued Shares |
Free Float |
||
|
Saudi Investors |
Retail |
1.62% |
4.60% |
1.63% |
4.60% |
0.01% |
-- |
|
High-Net-Worth Investors |
2.73% |
7.71% |
2.75% |
7.71% |
0.02% |
-- |
|
|
Individual Professional Investors |
4.87% |
10.89% |
4.90% |
10.93% |
0.03% |
0.04% |
|
|
Individual DPMs |
0.18% |
0.51% |
0.18% |
0.51% |
-- |
-- |
|
|
Total (Retail) |
9.40% |
23.71% |
9.47% |
23.76% |
0.07% |
(0.04%) |
|
|
Corporates |
16.78% |
40.01% |
16.81% |
39.89% |
0.03% |
(0.12%) |
|
|
|
Mutual Funds |
3.04% |
7.25% |
3.06% |
7.26% |
0.02% |
0.01% |
|
|
Government Entities |
64.46% |
12.90% |
64.25% |
12.85% |
(0.21%) |
(0.05%) |
|
Institutional DPMs |
0.75% |
2.07% |
0.76% |
2.08% |
0.01% |
0.01% |
|
|
Total (Corporate Investors) |
85.03% |
62.23% |
84.88% |
62.08% |
(0.15%) |
(0.15%) |
|
|
Total (Saudi Investors) |
94.43% |
85.94% |
94.35% |
85.83% |
(0.09%) |
(0.11%) |
|
|
GCC Investors |
Individuals |
0.05% |
0.15% |
0.05% |
0.15% |
-- |
-- |
|
Institutions |
0.72% |
1.24% |
0.73% |
1.25% |
0.01% |
0.01% |
|
|
DPMs |
0.04% |
0.12% |
0.04% |
0.12% |
-- |
-- |
|
|
Total (GCC Investors) |
0.81% |
1.51% |
0.82% |
1.52% |
0.01% |
0.01% |
|
|
Foreign Investors |
SWAP Holders |
0.02% |
0.07% |
0.03% |
0.07% |
-- |
-- |
|
Foreign Residents |
0.21% |
0.62% |
0.21% |
0.61% |
-- |
(0.01%) |
|
|
Qualified Investors |
3.87% |
11.42% |
3.91% |
11.48% |
0.05% |
0.07% |
|
|
DPMs |
0.15% |
0.44% |
0.16% |
0.48% |
0.01% |
0.04% |
|
|
Strategic Investors |
0.50% |
-- |
0.52% |
-- |
0.01% |
-- |
|
|
Total (Foreign Investors) |
4.76% |
12.55% |
4.83% |
12.65% |
0.07% |
0.10% |
|
|
Ownership’s Value & Ratio by Investor Classification (SAR bln) |
|||||||
|
Investor Type |
Jan. 15, 2026 |
Jan. 22, 2026 |
Change in Ownership |
||||
|
Equity |
Issued Shares |
Free Float |
Equity |
Issued Shares |
Free Float |
||
|
Institutional |
8735.82 |
95.38% |
86.91% |
8918.57 |
95.36% |
86.92% |
182.76 |
|
Non-Institutional |
423.01 |
4.62% |
13.09% |
434.40 |
4.64% |
13.08% |
11.39 |
|
Total |
9158.82 |
100% |
100% |
9352.97 |
100% |
100% |
194.15 |
Comments {{getCommentCount()}}
Be the first to comment
رد{{comment.DisplayName}} على {{getCommenterName(comment.ParentThreadID)}}
{{comment.DisplayName}}

{{comment.ElapsedTime}}


Comments Analysis: