An ATM machine
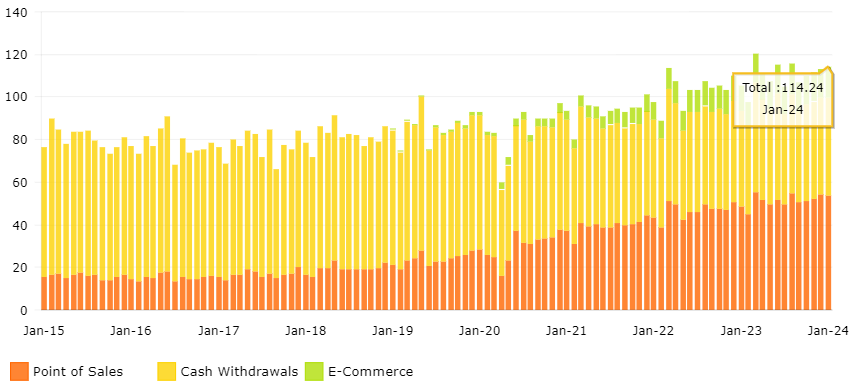
Consumer spending in Saudi Arabia grew by 9% to SAR 114.2 billion in January 2024 from nearly SAR 105.2 billion a year earlier.
For more details on consumer spending from Argaam Tools
Consumer spending in Saudi Arabia represents total cash withdrawals, point-of-sale (POS) transactions, and e-commerce via Mada cards.
|
Consumer Spending (SAR bln) |
|||
|
Period |
2023 |
2024 |
Change |
|
January |
105.19 |
114.24 |
+9% |
|
February |
97.85 |
-- |
-- |
|
March |
120.62 |
-- |
-- |
|
April |
111.51 |
-- |
-- |
|
May |
107.43 |
-- |
-- |
|
June |
115.41 |
-- |
-- |
|
July |
104.63 |
-- |
-- |
|
August |
115.42 |
-- |
-- |
|
September |
106.61 |
-- |
-- |
|
October |
110.01 |
-- |
-- |
|
November |
111.47 |
-- |
-- |
|
December |
113.53 |
-- |
-- |
POS transactions saw an 11% year-on-year (YoY) rise to around SAR 53.8 billion in January.
Data showed that 8.29 billion transactions were processed through 1.76 million POS terminals during the same period.
POS transactions represent the expenditures made by consumers using their ATM cards and credit cards at shopping malls, retail stores, pharmacies, and other retail outlets.
The table below indicates the development of POS transactions:
|
POS Transactions (SAR bln) |
|||
|
Period |
2023 |
2024 |
Change |
|
January |
48.33 |
53.80 |
+11% |
|
February |
44.80 |
-- |
-- |
|
March |
55.41 |
-- |
-- |
|
April |
51.57 |
-- |
-- |
|
May |
49.80 |
-- |
-- |
|
June |
51.85 |
-- |
-- |
|
July |
49.35 |
-- |
-- |
|
August |
54.64 |
-- |
-- |
|
September |
50.50 |
-- |
-- |
|
October |
51.10 |
-- |
-- |
|
November |
52.37 |
-- |
-- |
|
December |
54.23 |
-- |
-- |

These withdrawals were processed through 15,900 ATMs in 128.2 million transactions.
|
ATM Withdrawals (SAR bln) |
|||
|
Period |
2023 |
2024 |
Change |
|
January |
45.15 |
46.01 |
+2% |
|
February |
41.74 |
-- |
-- |
|
March |
51.70 |
-- |
-- |
|
April |
47.32 |
-- |
-- |
|
May |
44.93 |
-- |
-- |
|
June |
50.17 |
-- |
-- |
|
July |
42.38 |
-- |
-- |
|
August |
46.40 |
-- |
-- |
|
September |
42.26 |
-- |
-- |
|
October |
45.49 |
-- |
-- |
|
November |
45.62 |
-- |
-- |
|
December |
45.67 |
-- |
-- |

E-commerce sales through Mada cards climbed 23% YoY to SAR 14.4 billion in January.
According to monthly data issued by the Saudi Central Bank (SAMA), these sales were made through 83.4 million transactions.
Online sales include transactions processed through Mada cards for payments and purchases made via online shopping and applications. However, these do not include transactions conducted using Visa, Mastercard, or other credit cards.
The table below indicates the development of online sales via Mada cards:
|
Online Sales via Mada Cards (SAR bln) |
|||
|
Period |
2023 |
2024 |
Change |
|
January |
11.71 |
14.43 |
+23% |
|
February |
11.32 |
-- |
-- |
|
March |
13.50 |
-- |
-- |
|
April |
12.63 |
-- |
-- |
|
May |
12.71 |
-- |
-- |
|
June |
13.39 |
-- |
-- |
|
July |
12.90 |
-- |
-- |
|
August |
14.38 |
-- |
-- |
|
September |
13.85 |
-- |
-- |
|
October |
13.42 |
-- |
-- |
|
November |
13.48 |
-- |
-- |
|
December |
13.63 |
-- |
-- |

Be the first to comment


Comments Analysis: