

-
 Bank Ranking
Banks Ratios
Cement Statistics
Cement Ranking
Cement Ratios
Monetary and Economic Statistics
Oil, Gas and Fuel
Macro Economy
Consumer Spending
Inflation
Exports & Imports
Food Prices
Non Food Prices
Construction Materials
Petrochem. Ranking
Petrochem. Ratios
Retail Rankings
Retail Ratios
Grocery Ranking
Grocery Ratios
Top Growth
Dividend History
Bank Ranking
Banks Ratios
Cement Statistics
Cement Ranking
Cement Ratios
Monetary and Economic Statistics
Oil, Gas and Fuel
Macro Economy
Consumer Spending
Inflation
Exports & Imports
Food Prices
Non Food Prices
Construction Materials
Petrochem. Ranking
Petrochem. Ratios
Retail Rankings
Retail Ratios
Grocery Ranking
Grocery Ratios
Top Growth
Dividend History
5,651 mineralization sites discovered in Saudi Arabia until 2024

Content Summary: 
Non-metallic minerals sites represent 54.1% of total, metallic minerals 42.9% by 2024-end: GASTAT
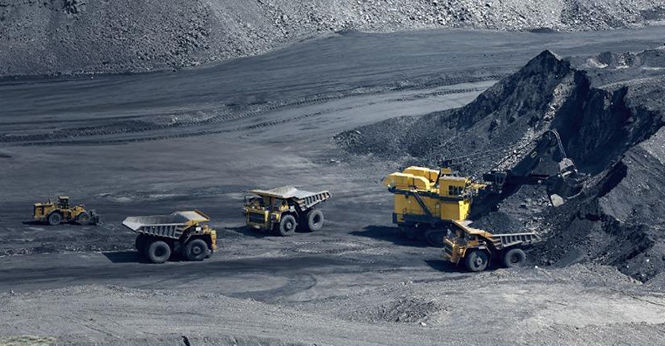
Saudi Arabia identified 5,651 mineralization sites by the end of 2024, according to the Mineral Resources 2024 data published by the General Authority for Statistics (GASTAT).
Riyadh accounted for the largest share with 1,620 sites, representing about 29% of the total. It was followed by Madinah with 887 sites (around 16%) and Makkah with 813 sites.
The table below shows the number of discovered mineralization sites by administrative region up to 2024:
|
Mineralization Sites by Region until 2024 |
||
|
Region |
No. of sites |
% of total |
|
Riyadh |
1,620 |
28.7% |
|
Madinah |
887 |
15.7% |
|
Makkah |
813 |
14.4% |
|
Tabuk |
461 |
8.2% |
|
Asir |
460 |
8.1% |
|
Al Qassim |
420 |
7.4% |
|
Eastern Region |
382 |
6.8% |
|
Hail |
285 |
5.0% |
|
Al Baha |
95 |
1.7% |
|
Al Jouf |
69 |
1.2% |
|
Jazan |
59 |
1.0% |
|
Najran |
59 |
1.0% |
|
Northern Borders |
41 |
0.7% |
|
Total |
5,651 |
100% |

The number of very high-importance sites reached 99, high-importance sites totaled 944, and medium-importance sites numbered 1,833.
Meanwhile, low-importance sites totaled 1,516, and very low-importance sites 1,259.
The table below shows the total mineralization sites by level of importance up to 2024:
|
Mineralization Sites by Importance Level until 2024 |
||
|
Importance |
Total |
% of total |
|
Very High |
99 |
1.7 % |
|
High |
944 |
16.7% |
|
Intermediate |
1,833 |
32.4 % |
|
Low |
1,516 |
26.8 % |
|
Very Low |
1,259 |
22.3 % |

Non-metallic minerals accounted for the largest share of discovered mineralization sites, representing 54.1% with 3,058 sites in 2024, followed by metallic minerals at 42.9%. Meanwhile, sites containing both metallic and non-metallic minerals accounted for about 3%.
According to the data, limestone topped the list of economically important non-metallic minerals with 490 sites, representing around 16% of the total, followed by clay with 354 sites, and aggregates with 325 sites (approximately 11%).
The table below provides further details:
|
Non-Metallic Minerals Sites until 2024 |
||
|
Raw mineral |
No. of sites |
% of total |
|
Limestone |
490 |
16.0% |
|
Clay |
354 |
11.6% |
|
Aggregates |
325 |
10.6% |
|
Granite |
189 |
6.2% |
|
Gravel with sand |
180 |
5.9% |
|
Sand |
160 |
5.2% |
|
Sandstone |
146 |
4.8% |
|
Basalt |
134 |
4.4% |
|
Lightweight aggregate |
123 |
4.0% |
|
Marble |
105 |
3.4% |
|
Dolomite |
103 |
3.4% |
|
Quartz |
85 |
2.8% |
|
Gypsum |
79 |
2.6% |
|
Feldspar |
51 |
1.7% |
|
Phosphate |
48 |
1.6% |
|
Silica sand |
31 |
1.0% |
|
Scoria/Pozzolanic pumice |
29 |
1.0% |
|
Tuff |
27 |
0.9% |
|
Barite |
26 |
0.9% |
|
Fluorite |
26 |
0.9% |
|
Salt |
23 |
0.8% |
|
Coal |
22 |
0.7% |
|
Asbestos |
21 |
0.7% |
|
Other |
281 |
9.2% |
|
Total |
3058 |
100% |
Meanwhile, the total number of discovered mineralization sites for metallic minerals reached approximately 2,423 by the end of last year.
According to the statistics, the largest share was concentrated in five economically significant metals, led by gold with 840 sites (35% of the total), followed by copper with 558 sites (over 23%). Both are considered key strategic metals for the Kingdom’s future mining projects.
The number of silver mineralization sites reached 250, representing more than 10% of the total, followed by gossan with 167 sites, and iron with 149 sites, as shown below:
|
Metallic Minerals Sites until 2024 |
||
|
Raw mineral |
No. of sites |
% of total |
|
Gold |
840 |
34.7% |
|
Copper |
558 |
23.0% |
|
Silver |
250 |
10.3% |
|
Gossan |
167 |
6.9% |
|
Iron |
149 |
6.2% |
|
Chromium |
109 |
4.5% |
|
Zinc (Galena) |
80 |
3.3% |
|
Tungsten |
40 |
1.7% |
|
Lead |
39 |
1.6% |
|
Nickel |
29 |
1.2% |
|
Thorium |
28 |
1.2% |
|
Zirconium |
27 |
1.1% |
|
Uranium |
24 |
1.0% |
|
Molybdenum |
21 |
0.9% |
|
Tin |
10 |
0.4% |
|
Niobium |
9 |
0.4% |
|
Manganese |
8 |
0.3% |
|
Antimony |
7 |
0.3% |
|
Cerium |
7 |
0.3% |
|
Rare Earth Elements |
5 |
0.2% |
|
Beryllium |
4 |
0.2% |
|
Lithium |
3 |
0.1% |
|
Strontium |
2 |
0.1% |
|
Titanium |
2 |
0.1% |
|
Arsenic |
1 |
0.04% |
|
Yttrium |
1 |
0.04% |
|
Osmium |
1 |
0.04% |
|
Mercury |
1 |
0.04% |
|
Lanthanum |
1 |
0.04% |
|
Total |
2,423 |
100% |
The total number of discovered mineralization sites containing both non-metallic and metallic minerals reached approximately 3%, or 170 sites, by the end of last year.
Barite accounted for the largest share with 26 sites, representing 15% of the total, followed by gold and copper with 21 sites each, as shown below:
|
Sites with Non-Metallic & Metallic Minerals until 2024 |
||
|
Raw mineral |
No. of sites |
% of total |
|
Barite |
26 |
15.3% |
|
Gold |
21 |
12.4% |
|
Copper |
21 |
12.4% |
|
Gossan |
15 |
8.8% |
|
Iron |
13 |
7.6% |
|
Pyrite |
9 |
5.3% |
|
Silver |
8 |
4.7% |
|
Tungsten |
7 |
4.1% |
|
Fluorite |
6 |
3.5% |
|
Lead |
5 |
2.9% |
|
Zinc (Galena) |
4 |
2.4% |
|
Phosphate |
4 |
2.4% |
|
Tin |
4 |
2.4% |
|
Molybdenum |
4 |
2.4% |
|
Other |
23 |
13.5% |
|
Total |
170 |
100% |
Comments {{getCommentCount()}}
Be the first to comment
رد{{comment.DisplayName}} على {{getCommenterName(comment.ParentThreadID)}}
{{comment.DisplayName}}

{{comment.ElapsedTime}}


Comments Analysis: