

-
 Bank Ranking
Banks Ratios
Cement Statistics
Cement Ranking
Cement Ratios
Monetary and Economic Statistics
Oil, Gas and Fuel
Macro Economy
Consumer Spending
Inflation
Exports & Imports
Food Prices
Non Food Prices
Construction Materials
Petrochem. Ranking
Petrochem. Ratios
Retail Rankings
Retail Ratios
Grocery Ranking
Grocery Ratios
Top Growth
Dividend History
Bank Ranking
Banks Ratios
Cement Statistics
Cement Ranking
Cement Ratios
Monetary and Economic Statistics
Oil, Gas and Fuel
Macro Economy
Consumer Spending
Inflation
Exports & Imports
Food Prices
Non Food Prices
Construction Materials
Petrochem. Ranking
Petrochem. Ratios
Retail Rankings
Retail Ratios
Grocery Ranking
Grocery Ratios
Top Growth
Dividend History

Combined profit of TASI firms ex-Aramco rise 25% to SAR 48.8B in Q2 2026

 AI Summary

Content Summary: 
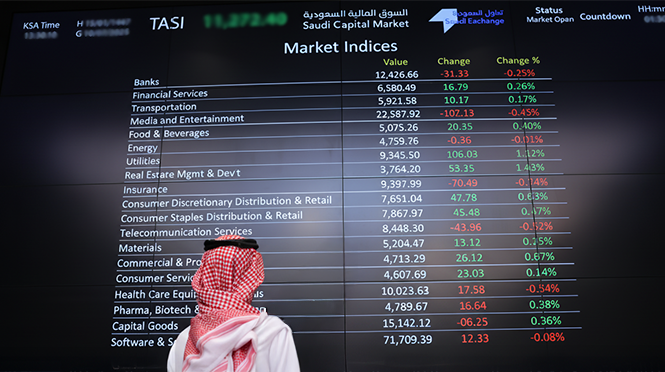
Tadawul trading screen
Tadawul-listed companies, excluding Saudi Aramco, reported a 25% rise year-on-year (YoY) in Q2 2026 aggregate net earnings to SAR 48.8 billion, compared to SAR 38.9 billion in the same period a year earlier, driven mainly by banks, petrochemicals and energy sectors.
The overall results of Saudi companies showed a 37% increase YoY in combined profits to around SAR 170.3 billion by the end of the second quarter of 2026. Saudi Aramco accounted for 72% of the aggregate earnings, as its profit grew by 42% YoY to SAR 121.51 billion.
|
Aggregate Net Profit in Q2 2026 (SAR bln)* |
|||||
|
Period |
Saudi Market (TASI) |
Change (%) |
TASI ex-Aramco |
Change (%) |
|
|
2025 |
|||||
|
Q1 |
136.8 |
-- |
41.1 |
+22% |
|
|
Q2** |
124.6 |
(16%) |
38.9 |
(7%) |
|
|
Q3 |
143.7 |
+1% |
46.5 |
+5% |
|
|
Q4**** |
85.0 |
(35%) |
15.5 |
(65%) |
|
|
2026 |
|||||
|
Q1 |
166.8 |
+22% |
46.6 |
+13% |
|
|
Q2**** |
170.3 |
+37% |
48.8 |
+25% |
|
**This includes a decline of SAR 3.466 billion, mainly related to the closure of a refining, chemicals and marketing facility in Aramco’s results.
***This includes exceptional losses of SAR 23.54 billion during Q4 2025 due to the reclassification of assets as held for sale, in addition to SAR 16 billion in provisions for petrochemicals and thermoplastics operations, as well as SAR 1.76 billion representing Tasnee’s share in impairment provisions related to the ilmenite smelting complex.
***Aramco’s results included non-recurring losses of SAR 4.71 billion, comprising SAR 4.1 billion in additional capitalized borrowing costs and SAR 0.61 billion in impairment losses related to assets associated with SABIC’s thermoplastic engineering plastics business.
A total of 172 firms reported earnings in the three-month period, 12 of which swung to profit, while 114 posted profit growth and 58 others reported lower profit YoY.
Meanwhile, 60 companies operating in different sectors incurred losses in Q2 2026, including 38 that turned to loss-making, mainly MBC Group and Al Othaim.
Market Sectors Performance
At the sector level, the Energy sector continued to account for the largest share of the combined net profit of Saudi-listed companies in Q2 2026, contributing 74.6% of aggregate earnings. The sector’s profit rose 50% to more than SAR 127 billion, driven by higher earnings at Aramco following an increase in the average selling price of crude oil and refined products. Bahri’s profit also increased more than sixfold year-on-year to SAR 2.75 billion, supported by stronger performance across its operating segments and higher global freight rates.
The Banking sector ranked second in terms of profitability, accounting for 14.6% of the market’s aggregate earnings. Its profits increased 8% to around SAR 24.87 billion, backed by broad-based quarterly earnings growth across the sector’s banks, driven by lower provisions and higher net special commission income.
The Telecommunications sector ranked third, contributing around 2.8% of total market earnings, with profit of SAR 4.8 billion, slightly down YoY. The decline was mainly attributable to a 5% fall in stc’s Q2 profit, which was affected by higher financing costs, while the year-earlier quarter had benefited from the reversal of a Zakat provision.
The Basic Materials sector came fifth, with SAR 1.82 billion profit, accounting for approximately 1.1% of the market's combined earnings. The improvement was driven by better petrochemical sector performance, mainly due to a reduction in SABIC’s losses, as the corresponding quarter included SAR 4.5 billion in impairment and restructuring charges. The sector was also supported by Petro Rabigh’s return to profitability, with a profit of SAR 2.66 billion, against a loss of SAR 1.37 billion in the Q2 2025, driven by higher sales volumes and selling prices for refined and petrochemical products, in addition to higher profit reported y both Yansab and Alujain.
Meanwhile, the Utilities sector posted SAR 3.02 billion profit, down 20% YoY, due to lower earnings at Saudi Energy, in addition to losses recorded by Marafiq.
|
Aggregate Net Profit by Sector (SAR mln)* |
||||||
|
Current Rank |
Rank YoY |
Sector |
Q2 2025 |
Q2 2026 |
Change (%) |
Sector Contribution |
|
1 |
1 |
Energy |
84844 |
127000 |
+50% |
74.6% |
|
2 |
2 |
Banks |
22985 |
24868 |
+8% |
14.6% |
|
3 |
3 |
Telecommunications |
4843 |
4796 |
(1%) |
2.8% |
|
4 |
4 |
Public Utilities |
3773 |
3018 |
(20%) |
1.8% |
|
5 |
21 |
Basic Materials |
(585) |
1803 |
-- |
1.1% |
|
6 |
5 |
Real Estate Management & Development |
1462 |
1455 |
-- |
0.9% |
|
7 |
6 |
Healthcare |
1351 |
1292 |
(4%) |
0.8% |
|
8 |
7 |
Food & Beverages |
1163 |
1137 |
(2%) |
0.7% |
|
9 |
8 |
Software & Services |
1122 |
1067 |
(5%) |
0.6% |
|
10 |
9 |
Capital Goods |
942 |
995 |
+6% |
0.6% |
|
11 |
10 |
Insurance |
739 |
924 |
+25% |
0.5% |
|
12 |
11 |
Financial Services |
601 |
640 |
+6% |
0.4% |
|
13 |
13 |
Consumer Services |
397 |
538 |
+36% |
0.3% |
|
14 |
14 |
Retailing |
358 |
375 |
+5% |
0.2% |
|
15 |
12 |
Consumer Staples Retailing |
446 |
275 |
(38%) |
0.2% |
|
16 |
15 |
Pharmaceuticals |
189 |
235 |
+24% |
0.1% |
|
17 |
16 |
Commercial & Professional Services |
160 |
202 |
+27% |
0.1% |
|
18 |
20 |
Transport |
(341) |
156 |
-- |
0.09% |
|
19 |
18 |
Household & Personal Products |
24 |
27 |
+10% |
0.02% |
|
20 |
19 |
Consumer Durables |
0.03 |
(12) |
-- |
-- |
|
21 |
17 |
Media & Entertainment |
105 |
(484) |
-- |
-- |
|
Total |
124577 |
170308 |
+37% |
100% |
||
Net profits of the top 10 profitable companies accounted for more than 90% of total market earnings in Q2 2026. Seven players recorded YoY profit hikes for the three-month period.
The list included Saudi National Bank (SNB), Al Rajhi Bank, Riyad Bank and Saudi Awwal Bank (SAB). This is in addition to stc and Bahri, as well as Petro Rabigh that swung to profitability.
|
Top 10 Profitable Companies (SAR mln) |
|||
|
Company |
Q2 2025 |
Q2 2026 |
Change (%) |
|
Saudi Aramco |
85632.0 |
121506.0 |
+42% |
|
Al Rajhi Bank |
6151.0 |
7012.1 |
+14% |
|
SNB |
6137.2 |
6605.9 |
+8% |
|
stc |
3823.5 |
3622.9 |
(5%) |
|
Bahri |
407.5 |
2746.8 |
+574% |
|
Petro Rabigh |
(1365.9) |
2660.6 |
-- |
|
Riyad Bank |
2596.6 |
2649.0 |
+2% |
|
Saudi Energy |
3058.2 |
2630.7 |
(14%) |
|
SAB |
2126.6 |
2331.1 |
+10% |
|
Maaden |
1921.8 |
2175.3 |
+13% |
Saudi Basic Industries Corp (SABIC) recorded the biggest loss of nearly SAR 832.9 million in Q2 2026, followed by Saudi Kayan and Sipchem. The list included flynas, MBC Group and Al Othaim Markets.
|
Top 10 Loss-Making Companies (SAR mln) |
|||
|
Company |
Q2 2025 |
Q2 2026 |
Change (%) |
|
SABIC |
(4066.1) |
(832.9) |
+80% |
|
Saudi Kayan |
(496.4) |
(672.8) |
(36%) |
|
Sipchem |
(169.2) |
(591.9) |
(250%) |
|
Tasnee |
(65.8) |
(547.8) |
(732%) |
|
MBC Group |
151.0 |
(262.5) |
-- |
|
flynas |
(862.5) |
(240.6) |
+72% |
|
Al Arabia |
(33.1) |
(214.5) |
(548%) |
|
AYYAN |
17.8 |
(119.2) |
-- |
|
Al Othaim* |
41.1 |
(107.1) |
-- |
|
Advanced |
81.6 |
(98.4) |
-- |
The aggregate profit for H1 2026 rose by 29% to reach SAR 337.08 billion, compared to SAR 266.62 billion in the similar period a year ago.
Excluding Aramco’s profit, the market's aggregate profit increased by 19% to SAR 95.44 billion, compared to SAR 80.03 billion in H1 2025.
|
Aggregate Net Profit of Saudi Companies (SAR bln) |
|||
|
Period |
H1 2025 |
H1 2026 |
Change (%) |
|
Aggregate Profit |
261.34 |
337.06 |
+29% |
|
Aggregate profit excluding Aramco |
80.03 |
95.42 |
+19% |
Comments {{getCommentCount()}}
Be the first to comment
رد{{comment.DisplayName}} على {{getCommenterName(comment.ParentThreadID)}}
{{comment.DisplayName}}

{{comment.ElapsedTime}}


Comments Analysis: