
Search Result
- TASI
-
Energy
- 2222 - SAUDI ARAMCO
- 2030 - SARCO
- 2380 - PETRO RABIGH
- 4030 - BAHRI
- 2381 - ARABIAN DRILLING
- 2382 - ADES
- 1201 - TAKWEEN
- 1202 - MEPCO
- 1210 - BCI
- 1211 - MAADEN
- 1301 - ASLAK
- 1304 - ALYAMAMAH STEEL
- 1320 - SSP
- 2001 - CHEMANOL
- 2010 - SABIC
- 2020 - SABIC AGRI-NUTRIENTS
- 2090 - NGC
- 2150 - ZOUJAJ
- 2170 - ALUJAIN
- 2180 - FIPCO
- 2200 - APC
- 2210 - NAMA CHEMICALS
- 2220 - MAADANIYAH
- 2240 - SENAAT
- 2250 - SIIG
- 2290 - YANSAB
- 2300 - SPM
- 2310 - SIPCHEM
- 2330 - ADVANCED
- 2350 - SAUDI KAYAN
- 3002 - NAJRAN CEMENT
- 3003 - CITY CEMENT
- 3004 - NORTHERN CEMENT
- 3005 - UACC
- 3010 - ACC
- 3020 - YC
- 3030 - SAUDI CEMENT
- 3040 - QACCO
- 3050 - SPCC
- 3060 - YCC
- 3080 - EPCCO
- 3090 - TCC
- 3091 - JOUF CEMENT
- 3092 - RIYADH CEMENT
- 2060 - TASNEE
- 3008 - ALKATHIRI
- 3007 - OASIS
- 1321 - EAST PIPES
- 1322 - AMAK
- 2223 - LUBEREF
- 1324 - SALEH ALRASHED
- 2360 - SVCP
- 1323 - UCIC
- 4143 - TALCO
- 1212 - ASTRA INDUSTRIAL
- 4146 - GAS
- 1302 - BAWAN
- 1303 - EIC
- 4148 - ALWASAIL INDUSTRIAL
- 4145 - OGC
- 2040 - SAUDI CERAMICS
- 2110 - SAUDI CABLE
- 4144 - RAOOM
- 2160 - AMIANTIT
- 2320 - ALBABTAIN
- 2370 - MESC
- 4140 - SIECO
- 4141 - ALOMRAN
- 4142 - RIYADH CABLES
- 1214 - SHAKER
- 4110 - BATIC
- 4147 - CGS
- 4031 - SGS
- 4040 - SAPTCO
- 4260 - BUDGET SAUDI
- 2190 - SISCO HOLDING
- 4261 - THEEB
- 4263 - SAL
- 4262 - LUMI
- 4265 - CHERRY
- 4264 - FLYNAS
- 1810 - SEERA
- 6013 - DWF
- 1820 - BAAN
- 4170 - TECO
- 4290 - ALKHALEEJ TRNG
- 6017 - JAHEZ
- 6002 - HERFY FOODS
- 1830 - LEEJAM SPORTS
- 6012 - RAYDAN
- 4291 - NCLE
- 4292 - ATAA
- 6014 - ALAMAR
- 6015 - AMERICANA
- 6016 - BURGERIZZR
- 6018 - SPORT CLUBS
- 6019 - ALMASAR ALSHAMIL
- 4003 - EXTRA
- 4008 - SACO
- 4050 - SASCO
- 4190 - JARIR
- 4240 - CENOMI RETAIL
- 4191 - ABO MOATI
- 4051 - BAAZEEM
- 4192 - ALSAIF GALLERY
- 4193 - NICE ONE
- 4194 - BUILD STATION
- 4200 - ALDREES
- 4001 - A.OTHAIM MARKET
- 4006 - FARM SUPERSTORES
- 4061 - ANAAM HOLDING
- 4160 - THIMAR
- 4161 - BINDAWOOD
- 4162 - ALMUNAJEM
- 4164 - NAHDI
- 4163 - ALDAWAA
- 2050 - SAVOLA GROUP
- 2100 - WAFRAH
- 2270 - SADAFCO
- 2280 - ALMARAI
- 6001 - HB
- 2288 - NOFOTH
- 6010 - NADEC
- 6020 - GACO
- 6040 - TADCO
- 6050 - SFICO
- 6060 - SHARQIYAH DEV
- 6070 - ALJOUF
- 6090 - JAZADCO
- 2281 - TANMIAH
- 2282 - NAQI
- 2283 - FIRST MILLS
- 4080 - SINAD HOLDING
- 2284 - MODERN MILLS
- 2285 - ARABIAN MILLS
- 2286 - FOURTH MILLING
- 2287 - ENTAJ
- 4002 - MOUWASAT
- 4021 - CMCER
- 4004 - DALLAH HEALTH
- 4005 - CARE
- 4007 - ALHAMMADI
- 4009 - SAUDI GERMAN HEALTH
- 2230 - CHEMICAL
- 4013 - SULAIMAN ALHABIB
- 2140 - AYYAN
- 4014 - EQUIPMENT HOUSE
- 4017 - FAKEEH CARE
- 4018 - ALMOOSA
- 4019 - SMC HEALTHCARE
- 1010 - RIBL
- 1020 - BJAZ
- 1030 - SAIB
- 1050 - BSF
- 1060 - SAB
- 1080 - ANB
- 1120 - ALRAJHI
- 1140 - ALBILAD
- 1150 - ALINMA
- 1180 - SNB
- 2120 - SAIC
- 4280 - KINGDOM
- 4130 - SAUDI DARB
- 4081 - NAYIFAT
- 1111 - TADAWUL GROUP
- 4082 - MRNA
- 1182 - AMLAK
- 1183 - SHL
- 4083 - TASHEEL
- 4084 - DERAYAH
- 8010 - TAWUNIYA
- 8012 - JAZIRA TAKAFUL
- 8020 - MALATH INSURANCE
- 8030 - MEDGULF
- 8040 - MUTAKAMELA
- 8050 - SALAMA
- 8060 - WALAA
- 8070 - ARABIAN SHIELD
- 8190 - UCA
- 8230 - ALRAJHI TAKAFUL
- 8280 - LIVA
- 8150 - ACIG
- 8210 - BUPA ARABIA
- 8180 - ALSAGR INSURANCE
- 8170 - ALETIHAD
- 8100 - SAICO
- 8120 - GULF UNION ALAHLIA
- 8200 - SAUDI RE
- 8160 - AICC
- 8250 - GIG
- 8240 - CHUBB
- 8260 - GULF GENERAL
- 8300 - WATANIYA
- 8310 - AMANA INSURANCE
- 8311 - ENAYA
- 8313 - RASAN
- 4330 - RIYAD REIT
- 4331 - ALJAZIRA REIT
- 4332 - JADWA REIT ALHARAMAIN
- 4333 - TALEEM REIT
- 4334 - AL MAATHER REIT
- 4335 - MUSHARAKA REIT
- 4336 - MULKIA REIT
- 4338 - ALAHLI REIT 1
- 4337 - Al AZIZIAH REIT
- 4342 - JADWA REIT SAUDI
- 4340 - Al RAJHI REIT
- 4339 - DERAYAH REIT
- 4344 - SEDCO CAPITAL REIT
- 4347 - BONYAN REIT
- 4345 - ALINMA RETAIL REIT
- 4346 - MEFIC REIT
- 4348 - ALKHABEER REIT
- 4349 - ALINMA HOSPITALITY REIT
- 4350 - ALISTITHMAR REIT
- 4020 - ALAKARIA
- 4324 - BANAN
- 4323 - SUMOU
- 4090 - TAIBA
- 4100 - MCDC
- 4150 - ARDCO
- 4220 - EMAAR EC
- 4230 - RED SEA
- 4250 - JABAL OMAR
- 4300 - DAR ALARKAN
- 4310 - KEC
- 4320 - ALANDALUS
- 4321 - CENOMI CENTERS
- 4322 - RETAL
- 4326 - ALMAJDIAH
- 4325 - MASAR
- 4327 - AlRAMZ
- NOMU
-
Media and Entertainment
Consumer Durables & Apparel
Real Estate Mgmt & Dev't
- 9521 - INMAR
- 9535 - LADUN
- 9591 - VIEW
- 9610 - FIRST AVENUE
- 9634 - ADEER
- 9640 - ASAS MAKEEN
- 9648 - HAMAD BIN SAEDAN REAL ESTATE
- 9641 - HAWYIA
- 9515 - FESH FASH
- 9532 - HILWA
- 9536 - FADECO
- 9559 - BALADY
- 9564 - HORIZON FOOD
- 9555 - LEEN ALKHAIR
- 9612 - SAMA WATER
- 9622 - SMC
- 9644 - NAF
- 9650 - SAHAT ALMAJD
- 9530 - TIBBIYAH
- 9527 - AME
- 9544 - FUTURE CARE
- 9546 - NABA ALSAHA
- 9574 - PRO MEDEX
- 9594 - ALMODAWAT
- 9572 - ALRAZI
- 9587 - LANA
- 9600 - QOMEL
- 9604 - MIRAL
- 9626 - SMILE CARE
- 9616 - JANA
- 9627 - TMC
- 9620 - BALSM MEDICAL
- 9647 - WAJD LIFE
- 9513 - WATANI STEEL
- 9514 - ALNAQOOL
- 9523 - GROUP FIVE
- 9539 - AQASEEM
- 9548 - APICO
- 9553 - MOLAN
- 9565 - MEYAR
- 9552 - SAUDI TOP
- 9563 - BENA
- 9566 - LIME INDUSTRIES
- 9580 - ALRASHID INDUSTRIAL
- 9576 - PAPER HOME
- 9588 - RIYADH STEEL
- 9575 - MARBLE DESIGN
- 9599 - TAQAT
- 9601 - ALRASHEED
- 9605 - NEFT ALSHARQ
- 9607 - ASG
- 9609 - NAAS PETROL
- 9623 - ALBATTAL FACTORY
- 9631 - HKC
- 9510 - NBM
- 9533 - SPC
- 9542 - KEIR
- 9547 - RAWASI
- 9568 - MAYAR
- 9569 - ALMUNEEF
- 9578 - ATLAS ELEVATORS
- 9560 - WAJA
- 9611 - UFG
- 9624 - ALSHEHILI METAL
- 9633 - SERVICE EQUIPMENT
- 9639 - ANMAT
- 9583 - UNITED MINING
- 9608 - ALASHGHAL ALMOYSRA
- 9540 - TADWEEER
- 9545 - ALDAWLIAH
- 9570 - TAM DEVELOPMENT
- 9593 - PAN GULF
- 9597 - LEAF
- 9606 - THARWAH
- 9613 - SHALFA
- 9619 - MULTI BUSINESS
- 9621 - DRC
- 9625 - ITMAM
- 9645 - SIGN WORLD
- 9541 - ACADEMY OF LEARNING
- 9562 - FOOD GATE
- 9590 - ARMAH
- 9598 - ALMOHAFAZA FOR EDUCATION
- 9603 - HORIZON EDUCATIONAL
- 9567 - GHIDA ALSULTAN
- 9617 - ARABICA STAR
- 9630 - RATIO
- 9628 - LAMASAT
- 9632 - FUTURE VISION
- 9636 - AlKUZAMA
- 9581 - CLEAN LIFE
- 9522 - ALHASOOB
- 9537 - AMWAJ INTERNATIONAL
- 9551 - KNOWLEDGE TOWER
- 9589 - FAD
- 9649 - JAMJOOM FASHION
- 9651 - ALTWIJRI

Sign In
×Forgot password?
×-
 Bank Ranking
Banks Ratios
Cement Statistics
Cement Ranking
Cement Ratios
Monetary and Economic Statistics
Oil, Gas and Fuel
Macro Economy
Consumer Spending
Inflation
Exports & Imports
Food Prices
Non Food Prices
Construction Materials
Petrochem. Ranking
Petrochem. Ratios
Retail Rankings
Retail Ratios
Grocery Ranking
Grocery Ratios
Top Growth
Dividend History
Bank Ranking
Banks Ratios
Cement Statistics
Cement Ranking
Cement Ratios
Monetary and Economic Statistics
Oil, Gas and Fuel
Macro Economy
Consumer Spending
Inflation
Exports & Imports
Food Prices
Non Food Prices
Construction Materials
Petrochem. Ranking
Petrochem. Ratios
Retail Rankings
Retail Ratios
Grocery Ranking
Grocery Ratios
Top Growth
Dividend History
Saudi Industrial Production Index rises 8.9% in December 2025

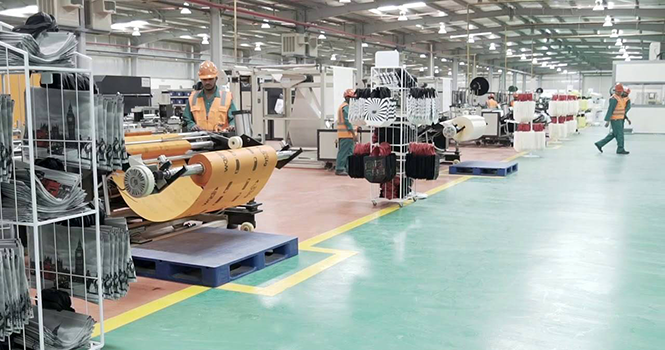
A manufacturing facility in Saudi Arabia
Saudi Arabia’s Industrial Production Index (IPI) rose 8.9% in December 2025 to 113.6 points, from 104.3 points a year earlier, according to data released by the General Authority for Statistics (GASTAT).
The overall IPI remained at 113.6 points in December (base year 2021), compared to 104.3 points recorded in December 2024.
GASTAT stated that the index rise was supported by growth in three main activities: mining and quarrying, manufacturing, as well as water supply, sanitation, waste management & treatment.
GASTAT defined IPI as a key economic indicator reflecting the relative changes and developments in industrial output, based on data from the industrial production survey. This survey covers establishments engaged in mining, manufacturing, electricity and gas supply, and water supply activities.
|
Industrial Production Index (IPI)* |
||
|
Period |
IPI (Points) |
Annual Change |
|
January 2024 |
102.58 |
(9.4%) |
|
February |
105.06 |
(6.3%) |
|
March |
104.45 |
(8.8%) |
|
April |
105.27 |
(6.4%) |
|
May |
107.26 |
(2.0%) |
|
June |
103.69 |
(5.8%) |
|
July |
104.66 |
+0.1% |
|
August |
106.57 |
+2.5% |
|
September |
106.25 |
+0.3% |
|
October |
106.99 |
+5.1% |
|
November |
103.64 |
+3.3% |
|
December |
104.32 |
+2.2% |
|
January 2025 |
103.58 |
+1.0% |
|
February |
105.27 |
+0.2% |
|
March |
108.22 |
+3.6% |
|
April |
105.53 |
+0.3% |
|
May |
108.82 |
+1.5% |
|
June |
110.17 |
+6.2% |
|
July |
112.68 |
+7.7% |
|
August |
113.92 |
+6.9% |
|
September |
116.38 |
+9.5% |
|
October |
115.25 |
+7.7% |
|
November |
113.65 |
+9.7% |
|
December |
113.56 |
+8.9% |

Mining and quarrying activity rose by 13.2% year-on-year (YoY) on higher oil production levels in the Kingdom in December 2025, reaching 10.1 million barrels per day (bpd), from 8.9 million bpd in December 2024.
Manufacturing activity increased by 3.2% YoY, supported by a 13.4% rise in the manufacturing of chemical products, while the manufacturing of coke and refined petroleum products declined by 3.6%.
|
Industrial Production Index by Constituent Activities |
|||
|
Main Sectors |
December 2024 |
December 2025 |
Change |
|
Mining & Quarrying |
97.7 |
110.6 |
+13.2% |
|
Manufacturing |
116.7 |
120.4 |
+3.2% |
|
Electricity, Gas, and Steam Supplies & Air-Conditioning |
92.4 |
90.1 |
(2.5%) |
|
Water Supply, Sanitation, Waste Management & Treatment Activities |
112.9 |
123.5 |
+9.4% |
|
IPI |
104.3 |
113.6 |
+8.9% |
Comments {{getCommentCount()}}
Be the first to comment
رد{{comment.DisplayName}} على {{getCommenterName(comment.ParentThreadID)}}
{{comment.DisplayName}}

{{comment.ElapsedTime}}


Market Indices
Popular Links
Quick Links
About Us
Join Us
Argaam Investment Company has updated the Privacy Policy of its services and digital platforms. Know more about our Privacy Policy here.
Argaam uses cookies to personalize content, to provide social media features and analyze traffic, that we might also share with third parties. You consent to our cookies if you use this website
Comments Analysis: