The World Gold Council’s Q1 2026 report points to a clear structural shift in the global gold market, with investment demand emerging as the key driver behind rising prices rather than traditional consumer demand.
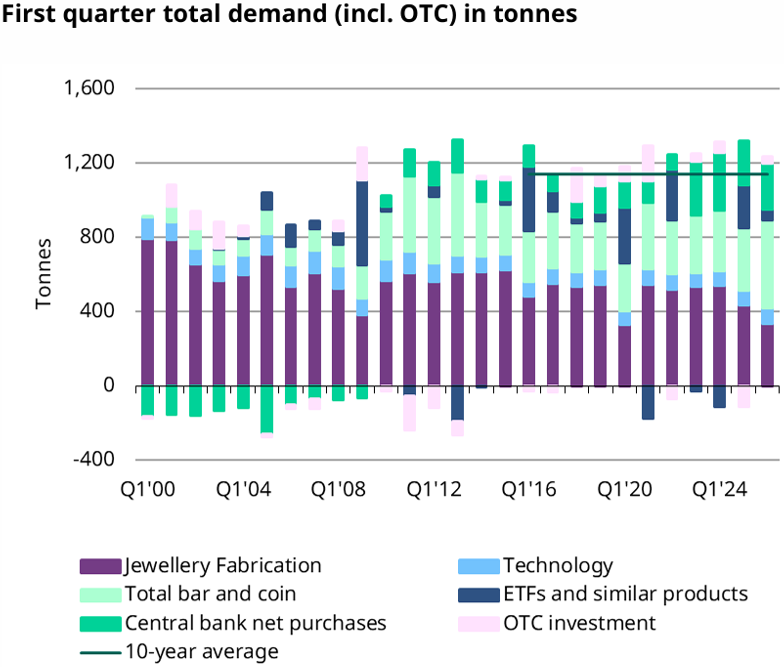
Total global gold demand reached 1,231 tons, up 2% year-on-year (YoY) in Q1 2026, while the total value of demand surged to a record $193 billion, supported by historic price gains. Average gold prices reached $4,873 per ounce during the quarter, with a record peak of $5,598 per ounce.
Investment in gold bars and coins led the market, with demand jumping 42% YoY to 474 tons, driven primarily by strong Asian demand, particularly from China and India, amid escalating geopolitical risks, a weaker US dollar, and mounting global inflation concerns.
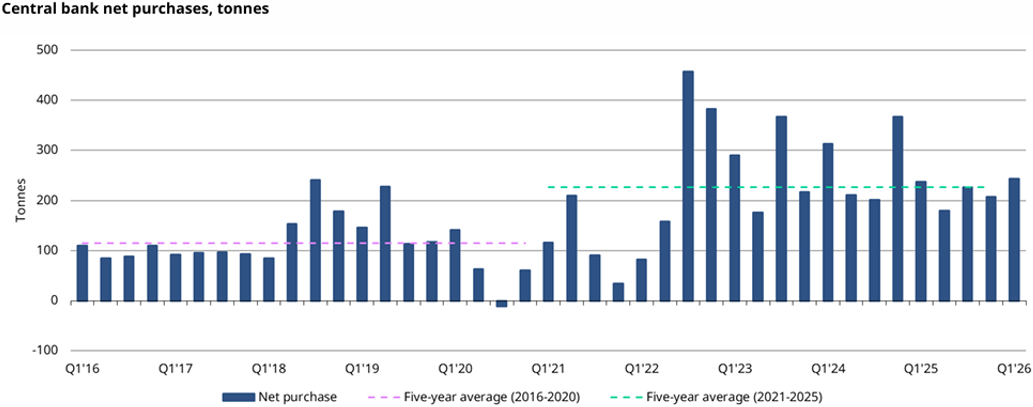
Central banks also continued strengthening gold reserves through robust purchases totaling 244 tons during the quarter, reflecting ongoing diversification of reserve assets and hedging against economic and geopolitical volatility.
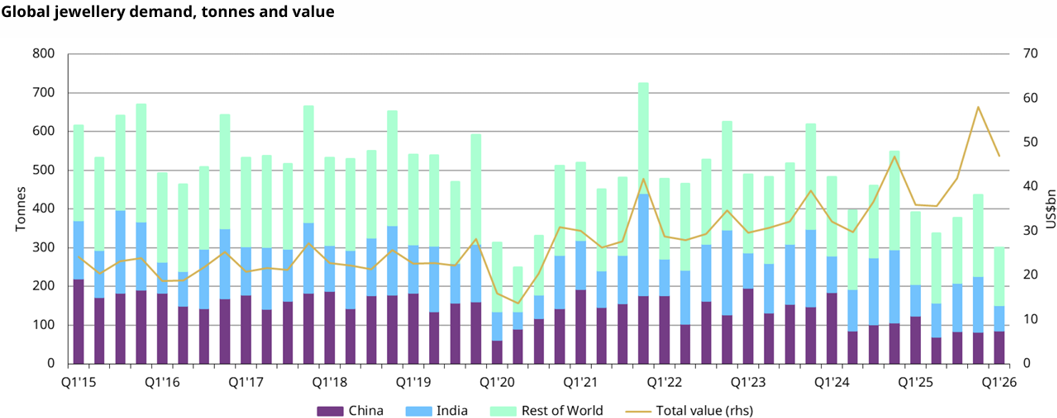
In contrast, jewelry demand came under significant pressure due to record-high prices, with purchased volumes falling 23% to below 300 tons for only the second time on record. However, jewelry spending value climbed to record levels, underscoring gold’s continued role as a store of value and savings instrument among consumers. Industrial demand posted modest growth, supported by expanding use of gold in electronics and AI infrastructure applications.
On the supply side, mine production and recycling rose slightly as producers benefited from elevated prices. The report expects supply growth to remain limited due to structural challenges facing the development of new mining projects.
The report also expects gold to remain supported throughout 2026 amid persistent geopolitical tensions, sustained Asian investment demand, and continued central bank buying, despite pressure from higher interest rates and weaker consumer jewelry demand.
Global gold demand, including OTC transactions, rose 2% YoY in Q1 2026 to 1,231 tons. Despite the relatively modest volume growth, the sharp rise in prices drove a 74% quarterly increase in demand to a record $193 billion.
Central banks extended their hedging trend with purchases of 244 tons, up 3% YoY, while industrial demand edged up 1% due to AI infrastructure expansion. Total supply also increased 2% annually to 1,231 tons, supported by higher mine output and faster recycling activity.
Gold price performance
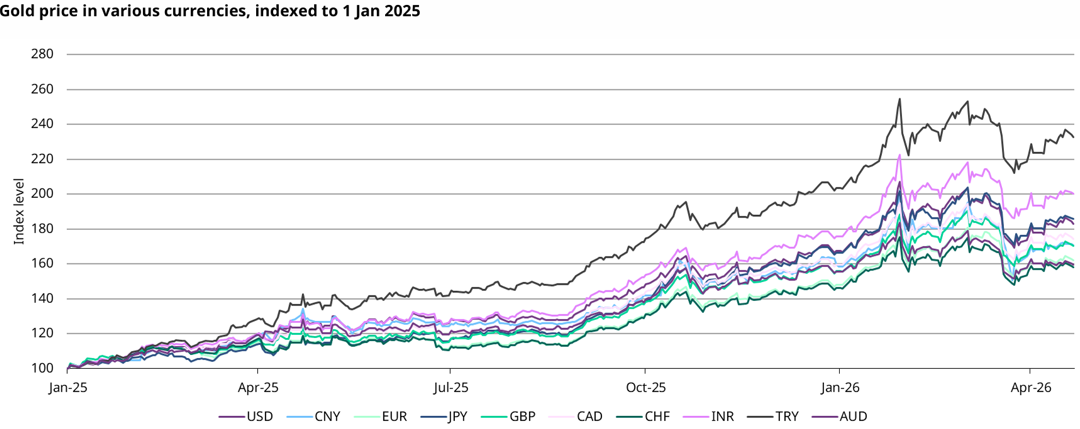
Gold delivered exceptional price performance in Q1 2026, with the average price reaching $4,873 per ounce, marking the highest quarterly average on record. Prices rose 6% during the quarter, hitting an all-time high of $5,598 per ounce in January before undergoing a notable correction in March.
|
Metric |
Q1 2025 |
Q2 2025 |
Q3 2025 |
Q4 2025 |
Q1 2026 |
YoY Change |
|
Average Price ($/oz) |
2,859.6 |
3,280.4 |
3,456.5 |
4,135.2 |
4,872.9 |
+70% |
|
Quarterly Peak |
-- |
-- |
-- |
-- |
5,598 |
Exceptional |
|
Quarterly Return |
-- |
-- |
-- |
-- |
+6% |
-- |
Key drivers behind the rally included escalating geopolitical risks, particularly tensions involving the US, Israel, and Iran, in addition to global inflation concerns, weakness in the US dollar, and accelerating reserve diversification by central banks.
Gold also maintained gains across multiple currencies, posting increases ranging from 20% to more than 100% compared with January 2025 levels.
|
Major Gold Supply & Demand Components (tons) |
|||||
|---|---|---|---|---|---|
|
Category |
Q1 2025 |
Q4 2025 |
Q1 2026 |
QoQ Change |
YoY Change |
|
Total Supply |
1,205.0 |
1,310.2 |
1,230.9 |
(6%) |
+2% |
|
Mine Production |
863.6 |
968.4 |
884.7 |
(9%) |
+2% |
|
Recycled Gold |
348.5 |
365.7 |
366.0 |
0 % |
+5% |
|
Jewelry Fabrication |
434.6 |
438.0 |
335.0 |
(24%) |
(23%) |
|
Technology |
80.4 |
82.1 |
81.6 |
(1%) |
+1% |
|
Total Investment |
563.6 |
602.9 |
535.6 |
(11%) |
(5%) |
|
Bars & Coins |
333.6 |
428.0 |
473.6 |
+11% |
+42% |
|
ETFs |
229.9 |
174.9 |
62.0 |
(65%) |
(73%) |
|
Central Banks |
237.0 |
207.6 |
243.7 |
+17% |
+3% |
|
Total Demand |
1,205.0 |
1,310.2 |
1,230.9 |
(6%) |
+2% |
Investment
Gold Bars & Coins
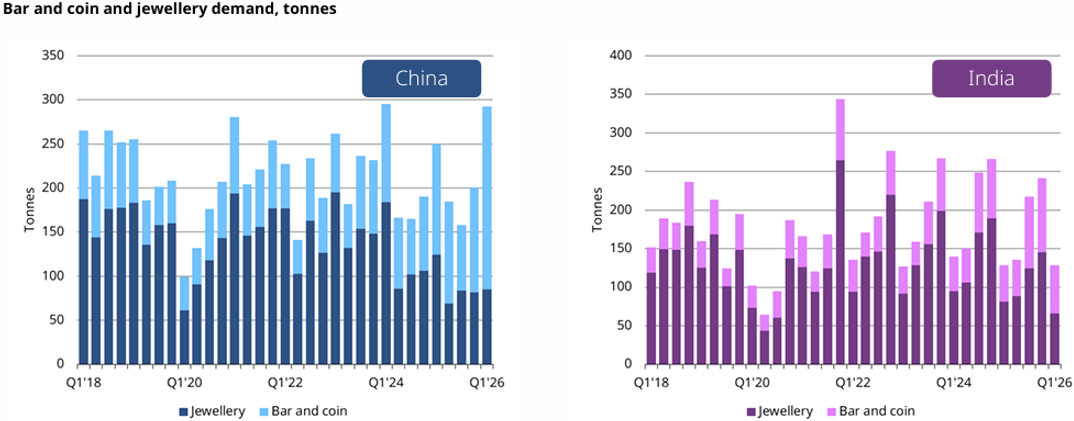
Investment demand for gold bars and coins surged to a record 473.6 tons in Q1 2026, marking the second-highest level in history after the 602-ton peak recorded in Q2 2013. However, the dollar value of this demand exceeded all previous records, climbing to $74 billion compared with an average of $23 billion over the past five years.
China – Unprecedented Momentum
China recorded a historic quarter in bars and coins investment, with demand surging 67% YoY to 206.9 tons in Q1 2026, well above the previous record of 155 tons set in Q2 2013.
Several factors supported demand, including gold’s strong price performance relative to other domestic assets, rising trade war risks, and regional geopolitical tensions. Market reports also indicated shortages of smaller investment products during January and February. In addition, VAT reforms on gold jewelry introduced in Q4 2025 shifted part of demand toward lower-cost bars and coins.
India – Structural Shift in Investor Behavior
Investment in bars and coins in India rose 34% YoY to 62.3 tons in Q1 2026, marking the strongest quarterly performance since 2013 and approaching jewelry demand levels of 66.1 tons in a historic shift for a market where jewelry purchases have traditionally far exceeded investment demand.
Europe & USA
Net European demand reached 41.2 tons during Q1 2026, up 50% YoY amid strong two-way trading activity during the period. US demand remained 14% higher YoY despite a quarterly decline, supported by new investor inflows attracted by gold’s strong price performance.
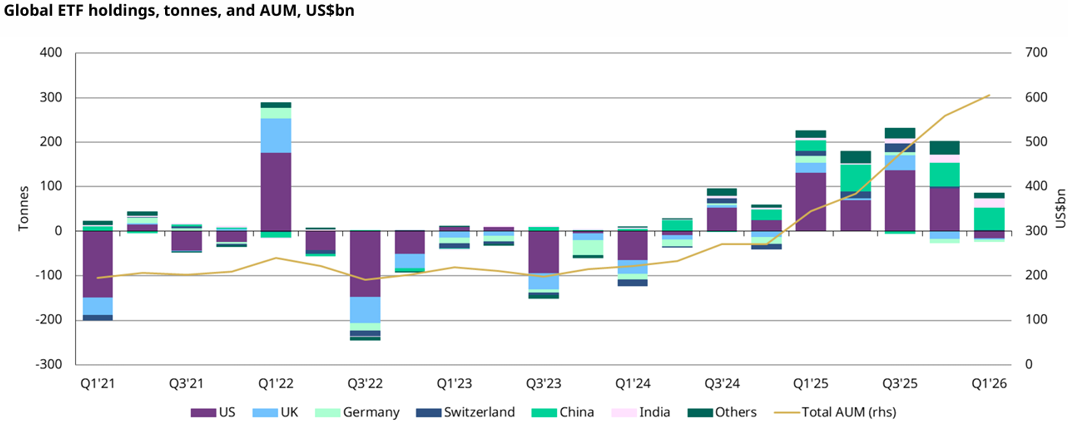
Gold ETFs
Gold ETFs recorded positive inflows for the seventh consecutive quarter, with global holdings increasing by 62 tons in Q1 2026, although at a much slower pace than the average 200 tons recorded over the previous four quarters. Momentum weakened due to significant outflows from US-listed funds in March, which offset much of the positive inflows seen in January and February.
|
Region |
Q1 2026 (tons) |
Note |
|---|---|---|
|
Asia (led by China) |
+ 84 |
Second-highest quarter on record |
|
Europe |
(8) |
Price correction pressures |
|
North America |
(16) |
End of nine-month inflow streak |
|
Other regions |
+ 2 |
Driven by Australia |
|
Global total |
+ 62 |
Assets under management (AUM) reached $607 billion |
Demand for Gold Jewelry
Global demand for gold jewelry fell to its lowest level since Q2 2020, declining 23% YoY to 299.7 tons, marking only the second time on record that demand has dropped below the 300-tonne threshold.
In contrast, the dollar value of demand rose 31% YoY to a record $47 billion, reflecting resilient consumer spending on gold despite elevated prices.
Striking Divergence in Jewelry Market
The data highlight an exceptional trend of declining volumes alongside rising spending. Consumers are paying more but receiving less in terms of weight, increasingly opting for lighter pieces, lower-carat products, or delaying purchases.
This pattern underscores continued loyalty to gold as both a cultural and investment asset, even amid high price levels.
|
Market |
Q1 2025 (tons) |
Q1 2026 (tons) |
YoY Change |
|---|---|---|---|
|
World |
391.2 |
299.7 |
(23%) |
|
Mainland China |
124.9 |
85.2 |
(32%) |
|
India |
81.6 |
66.1 |
(19%) |
|
Middle East |
45.1 |
34.5 |
(23%) |
|
Northern America |
31.7 |
21.1 |
(34%) |
|
Europe (exc. Russia) |
10.0 |
8.3 |
(16%) |
|
Turkey |
8.9 |
6.8 |
(23%) |
China
Jewelry demand in China fell 32% YoY to 85.2 tons in Q1 2026, pressured by higher prices, weak consumer confidence, and VAT reforms. However, the value of spending rose 16% annually to $13 billion.
India
The 19% YoY decline in India is notable, given an 81% rise in local gold prices. Demand value reached a record $10 billion. The data indicate a clear shift toward lighter, lower-carat jewelry, while demand for high-quality pieces remained resilient among higher-income consumers.
Middle East and Turkey
Jewelry demand declined modestly across Middle Eastern markets, but spending rose 30% YoY to a record $5 billion. Seasonal buying during Ramadan and Eid al-Fitr in February provided partial support before regional conflict weighed on demand.
Saudi Arabia
Gold markets across the Gulf and Middle East showed a clear divergence between consumer and investment demand in Q1 2026, reflecting the impact of record prices and geopolitical tensions. Regional jewelry demand fell 23% YoY to 34.5 tons, driven by higher prices and weaker purchasing power. However, the decline was uneven across Gulf markets, with Saudi Arabia standing out as relatively more resilient within the region.
In Saudi Arabia, jewelry demand fell to 12.7 tons in Q1 2026 from 14.6 tons a year earlier, marking a relatively modest 13% decline, well below the regional average. This points to comparatively resilient consumer demand in the Kingdom versus other markets in the region. On a quarterly basis, demand rebounded strongly by 41% from Q4 2025, reflecting improved seasonal buying supported by higher income levels and consumer spending during Ramadan and Eid al-Fitr.
At the same time, data point to a gradual shift in investor behavior in the Gulf toward gold as a savings and hedging instrument rather than purely a consumption good. While investment demand for bars and coins in the Middle East declined 7% YoY to 26.4 tons, the Saudi market showed relative stability, with demand rising to 5.1 tonnes from 4.4 tonnes a year earlier—an increase of around 15%. This suggests that Saudi investors are increasingly viewing gold as part of wealth management and a hedge against inflation and geopolitical risks, particularly amid elevated oil prices and regional tensions.
Gold recycling data also highlight a divergence in market dynamics. While gold recycling activity declined across the Middle East due to transport constraints and logistical disruptions linked to geopolitical tensions, Saudi Arabia recorded a nearly 9% annual rise. This reflects sustained liquidity in the local market and its ability to absorb trading flows despite regional challenges. It also indicates that higher prices have prompted some individuals to take advantage of record levels to generate liquidity or rebalance their gold holdings.
Overall, the Saudi gold market appears to be undergoing a structural transition. Beyond its traditional reliance on jewelry, investment demand is becoming more prominent, driven by hedging and wealth management considerations. If gold prices remain elevated and geopolitical tensions persist, demand for bars and coins in Saudi Arabia and the wider Gulf is likely to expand further, even as pressure continues on traditional jewelry consumption.
Central Banks’ Gold Purchases
Central banks maintained a high level of net purchases of 243.7 tons, up 3% YoY and 17% QoQ in Q1 2026. These figures confirm the strategic shift by central banks toward gold as a safe reserve asset amid current geopolitical tensions.
The largest buyers in Q1 were the National Bank of Poland (+31 tons), the Central Bank of Uzbekistan (+25 tons), the People’s Bank of China (+7 tons to 2,313 tons), the Central Bank of Kazakhstan (+12 tons), and the Czech National Bank (+5 tons). Other buyers included the central banks of Malaysia and Indonesia.
On the other hand, Turkey recorded strong sales (70 tons plus 80 tons via swaps), along with the sale of 22 tons by State Oil Fund of Azerbaijan (SOFAZ) and 22 tons by Russia. Turkey’s sales are considered tactical rather than a strategic shift, with holdings stabilizing at around 535 tons in April.
Industrial & Technological Demand
Industrial demand for gold edged up 1% YoY to 81.6 tons in Q1 2026, supported by the electronics sector, which grew 3% to 69.3 tons, its highest level since Q4 2021 amid continued expansion of AI infrastructure.
|
Sector |
Q1 2025 (tons) |
Q1 2026 (tons) |
YoY change |
|---|---|---|---|
|
Total Technology |
80.4 |
81.6 |
+1% |
|
Electronics |
67.1 |
69.3 |
+3% |
|
Other Industries |
11.3 |
10.4 |
(8%) |
|
Dentistry |
2.1 |
2.0 |
(7%) |
The electronics sector is showing mixed performance as high-end AI chips are driving strong demand, while consumer electronics manufacturers are reducing or replacing gold due to cost sensitivity. Some countries recorded demand growth, such as South Korea (+7%), Taiwan (+9%), the US (+6%), and China (+5%), while other countries showed weak demand, including Japan (-1%) and Europe (-3%).
Supply Analysis
Mine Production
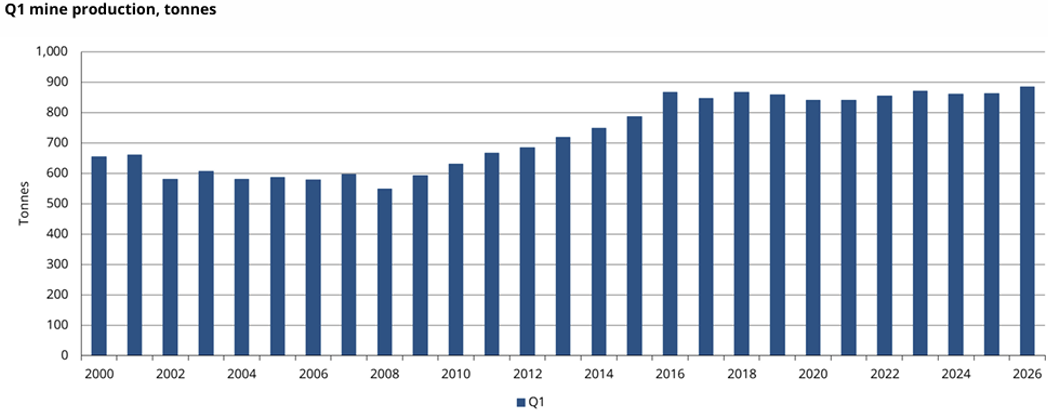
Mine production rose 2% YoY to 884.7 tons, the highest Q1 level on record since 2000. Higher prices are encouraging expansion of existing projects and capacity increases.
Key growth came from Mali (+30%), Indonesia (+19%), Canada (+15%), and Peru (+3%). Meanwhile, declines were seen in Namibia (-35%), Mexico (-12%), Australia (-7%), and China (-3%).
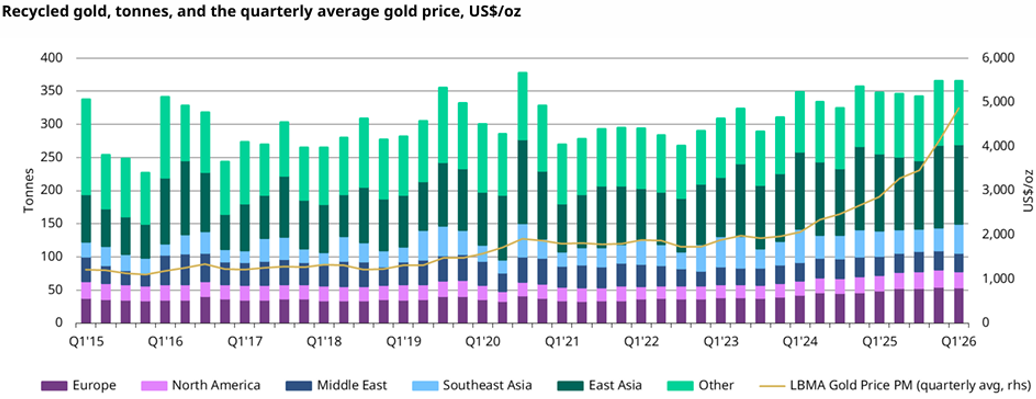
Gold Recycling
Gold recycling increased 5% YoY to 366 tons. Record prices supported recycling activity globally, although the Middle East, Europe, and North America faced processing constraints. Activity is expected to accelerate as bottlenecks ease and alternative logistics routes develop.
|
Region |
Trend |
Note |
|---|---|---|
|
India |
+20% YoY / +44% QoQ |
Base effects and FX impact |
|
China |
+3% YoY |
VAT effects on swap purchases |
|
Middle East |
(5%) YoY |
Logistics disruptions |
|
Turkey |
(21%) YoY |
Currency weakness |
|
Europe |
+9% YoY |
Refining constraints |
|
US |
+6% YoY |
Capacity limits |
Outlook
Geopolitical factors are expected to remain the main driver of gold demand in 2026 and beyond. The current environment of uncertainty supports continued net buying by central banks, global ETF inflows, and ongoing accumulation of gold bars and coins.
|
Demand Drivers |
Demand Pressures |
|
- Continued geopolitical risk premium - Strong Asian demand for bars and coins - Diversification of central bank reserves - Inflation concerns and lack of alternative investments - Growth of AI infrastructure |
- Pressure from record-high prices on consumer demand - Higher interest rates for longer - Weak and declining jewelry demand - Potential rise in recycling activity - Tactical rebalancing of central bank reserves |
Investment sector outlook
Investment demand is likely to remain positive, although it is expected to stay below 2025 levels. Gold bars and coins will continue to lead investment activity, particularly in Asia. ETF demand may decline from 2025 levels if interest rates remain elevated.
Central Banks Outlook
The World Gold Council expects central bank purchases to range between 700 and 900 tons in 2026, broadly in line with 2025 levels. Demand remains strongly supported despite price volatility and ongoing geopolitical risks.
Jewelry Sector Outlook
Jewelry demand is expected to remain under pressure throughout 2026. However, consumer sentiment may gradually improve as buyers adapt to the new price environment and if central banks begin cutting interest rates. Spending in terms of value is expected to remain strong despite weaker volumes.
Supply Outlook
Mining output is expected to grow only modestly, while recycling is expected to increase gradually. Potential supply disruptions in Asia due to diesel shortages should be monitored. Structural challenges remain in developing, permitting, financing, and operating new mining projects.
Be the first to comment


Comments Analysis: