

-
 Bank Ranking
Banks Ratios
Cement Statistics
Cement Ranking
Cement Ratios
Monetary and Economic Statistics
Oil, Gas and Fuel
Macro Economy
Consumer Spending
Inflation
Exports & Imports
Food Prices
Non Food Prices
Construction Materials
Petrochem. Ranking
Petrochem. Ratios
Retail Rankings
Retail Ratios
Grocery Ranking
Grocery Ratios
Top Growth
Dividend History
Bank Ranking
Banks Ratios
Cement Statistics
Cement Ranking
Cement Ratios
Monetary and Economic Statistics
Oil, Gas and Fuel
Macro Economy
Consumer Spending
Inflation
Exports & Imports
Food Prices
Non Food Prices
Construction Materials
Petrochem. Ranking
Petrochem. Ratios
Retail Rankings
Retail Ratios
Grocery Ranking
Grocery Ratios
Top Growth
Dividend History

In-depth: Saudi hotel occupancy, ADR in Q2 2026

 AI Summary

Content Summary: 
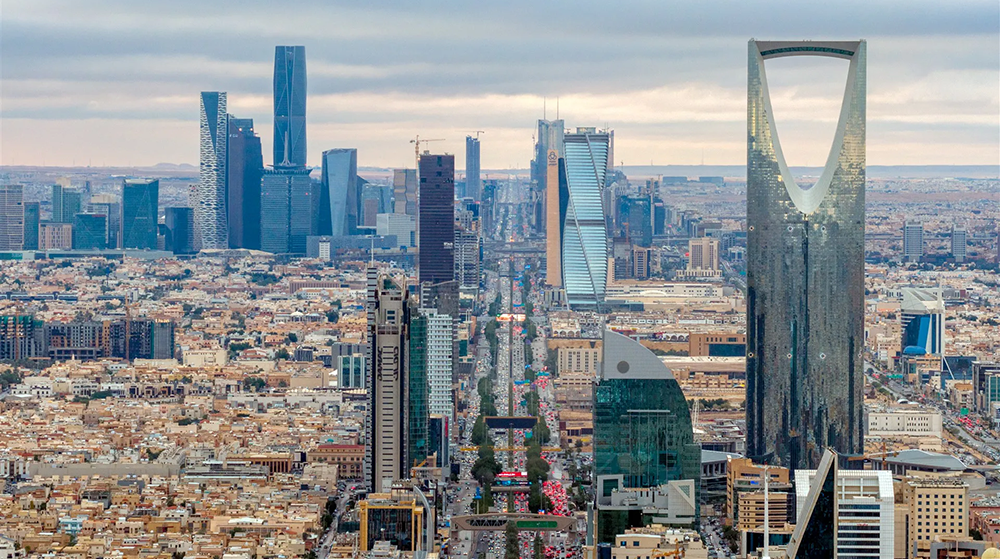
Riyadh city
Saudi Arabia's hotel room occupancy rate declined to 51% in Q2 2026, compared with 53.2% in the same period a year earlier.
The occupancy rate for serviced apartments and other hospitality facilities fell to 46.5% from 50.2%, according to the General Authority for Statistics (GASTAT) Tourism Establishments Statistics bulletin.
|
Occupancy Rates for Hotels, Serviced Apartments & Others |
||
|
Period |
Hotels (%) |
Serviced App. & Others |
|
Q1 2023 |
63.2% |
53% |
|
Q2 |
54.9% |
50.9% |
|
Q3 |
53.4% |
56.2% |
|
Q4 |
60.2% |
55.4% |
|
Q1 2024 |
60.9% |
54.5% |
|
Q2 |
55.4% |
52.4% |
|
Q3 |
46.1% |
58% |
|
Q4 |
56.0% |
55.9% |
|
Q1 2025 |
63% |
50.7% |
|
Q2 |
53.2% |
50.2% |
|
Q3 |
49.1% |
57.4% |
|
Q4 |
57.3% |
55.9% |
|
Q1 2026 |
60.8% |
51.6% |
|
Q2 |
51% |
46.5% |
Hotel and serviced apartment occupancy rates varied significantly across Saudi regions.
Madinah recorded the highest hotel occupancy rate at 65.3%, followed by Makkah at 50% and the Eastern Region at 47.8%.
Najran posted the highest occupancy rate for serviced apartments and other hospitality facilities at 54.2%, followed by Riyadh at 52.7% and the Eastern Region at 47.6%.
Tabuk recorded the lowest hotel occupancy rate at 28.6%, while Al Baha had the lowest occupancy rate for serviced apartments at 33.1%.
|
Room Occupancy Rate by Region |
||
|
Region |
Serviced Apt (%) |
Hotels (%) |
|
Madinah |
65.3% |
38.7% |
|
Makkah |
50% |
44.2% |
|
Eastern Province |
47.8% |
47.6% |
|
Northern Borders |
46.8% |
38.1% |
|
Qassim |
42.7% |
46.7% |
|
Riyadh |
42.7% |
52.7% |
|
Najran |
39.9% |
54.2% |
|
Asir |
38% |
43% |
|
Jazan |
36.4% |
40.7% |
|
Al-Baha |
34.3% |
33.1% |
|
Jouf |
33.7% |
38.7% |
|
Hail |
28.9% |
42.9% |
|
Tabuk |
28.6% |
35% |
The average daily room rate (ADR) for hotels stood at SAR 563 in Q2 2026, down 12.4% from Q2 2025. Meanwhile, the ADR for serviced apartments and other hospitality facilities reached SAR 197, marking a 2.1% YoY decline.
|
ADR (SAR) |
||
|
Period |
Hotels |
Serviced apartments & others |
|
Q1 2023 |
515 |
205 |
|
Q2 |
756 |
221 |
|
Q3 |
443 |
222 |
|
Q4 |
447 |
218 |
|
Q1 2024 |
494 |
195 |
|
Q2 |
669 |
199 |
|
Q3 |
354 |
200 |
|
Q4 |
440 |
220 |
|
Q1 2025 |
477 |
209 |
|
Q2 |
643 |
201 |
|
Q3 |
341 |
208 |
|
Q4 |
389 |
207 |
|
Q1 2026 |
423 |
206 |
|
Q2 |
563 |
197 |
The table below shows the ADR for hotels and serviced apartments and other hospitality facilities across Saudi regions in Q2 2026:
|
ADR by region (SAR) |
||
|
Region |
Hotels |
Serviced apartments |
|
Tabuk |
738 |
151 |
|
Madinah |
589 |
221 |
|
Makkah |
585 |
196 |
|
Riyadh |
541 |
230 |
|
Eastern Region |
433 |
196 |
|
Qassim |
390 |
154 |
|
Al Baha |
331 |
147 |
|
Hail |
331 |
176 |
|
Aseer |
297 |
141 |
|
Jazan |
290 |
214 |
|
Al Jouf |
246 |
132 |
|
Northern Borders |
207 |
133 |
|
Najran |
200 |
96 |
The average length of stay (ALOS) at hotels was about five nights in Q2 2026, while guests at serviced apartments and other hospitality facilities stayed for an average of two nights.
|
ALOS (nights) |
||
|
Period |
Hotels |
Serviced apartments and other hospitality facilities |
|
Q1 2023 |
3.7 |
2.5 |
|
Q2 |
4.4 |
2.4 |
|
Q3 |
3.7 |
2.5 |
|
Q4 |
3.6 |
2.4 |
|
Q1 2024 |
4.1 |
2.2 |
|
Q2 |
5.2 |
2.1 |
|
Q3 |
4.2 |
2.1 |
|
Q4 |
3.6 |
2.1 |
|
Q1 2025 |
4.1 |
2.1 |
|
Q2 |
4.8 |
2 |
|
Q3 |
4.1 |
2.1 |
|
Q4 |
3.8 |
2.2 |
|
Q1 2026 |
4.2 |
2.2 |
|
Q2 |
5 |
2 |
The table below shows the ALOS for hotels and serviced apartments and other hospitality facilities across Saudi regions in Q2 2026:
|
ALOS by region in Q2 2026 (nights) |
||
|
Region |
Hotels |
Serviced apartments |
|
Makkah |
7.3 |
1.9 |
|
Madinah |
4.3 |
2.6 |
|
Tabuk |
2.5 |
1.9 |
|
Northern Borders |
2.3 |
1.9 |
|
Riyadh |
2.1 |
2.1 |
|
Eastern Region |
2.1 |
2 |
|
Al Baha |
1.9 |
1.8 |
|
Aseer |
1.8 |
1.8 |
|
Al Jouf |
1.8 |
1.8 |
|
Jazan |
1.7 |
1.7 |
|
Qassim |
1.7 |
1.7 |
|
Hail |
1.6 |
1.7 |
|
Najran |
1.6 |
2.2 |
The number of workers in Saudi Arabia’s tourism sector grew by 7.2% YoY to 1.07 million in Q2 2026.
Of the total, 258,000 were Saudi nationals, representing 24.1%, while 811,100 were non-Saudis, accounting for the remaining 75.9%.
|
Tourism Employees (‘000 employees) |
|||
|
Period |
Saudis |
Non-Saudis |
Total |
|
Q1 2023 |
239.74 |
660.79 |
900.53 |
|
Q2 |
242.11 |
670.08 |
912.2 |
|
Q3 |
243.95 |
675.22 |
919.17 |
|
Q4 |
244.9 |
684.51 |
929.4 |
|
Q1 2024 |
247.71 |
696.59 |
944.3 |
|
Q2 |
245.91 |
713.27 |
959.18 |
|
Q3 |
240.77 |
707.86 |
948.63 |
|
Q4 |
242.07 |
724.46 |
966.53 |
|
Q1 2025 |
243.37 |
739.88 |
983.25 |
|
Q2 |
247.60 |
749.76 |
997.36 |
|
Q3 |
245.17 |
764.52 |
1,009.69 |
|
Q4 |
247.48 |
783.09 |
1,030.57 |
|
Q1 2026 |
250.09 |
797.22 |
1,047.31 |
|
Q2 |
258.04 |
811.08 |
1,069.12 |
Riyadh topped Saudi regions in terms of the number of workers in tourism activities at nearly 353,900, representing about 33% of the total. Makkah followed with approximately 298,900 workers.
|
Geographical Distribution of Tourism Employees |
||
|
Region |
No. of Employees ('000) |
Ratio to Total (%) |
|
Riyadh |
353.92 |
33.1% |
|
Makkah |
298.93 |
28% |
|
Eastern Region |
158.92 |
14.9% |
|
Madinah |
63.72 |
6% |
|
Aseer |
50.17 |
4.7% |
|
Qassim |
35.19 |
3.3% |
|
Jazan |
29.36 |
2.7% |
|
Tabuk |
28.74 |
2.7% |
|
Hail |
13.93 |
1.3% |
|
Najran |
12.81 |
1.2% |
|
Al Jouf |
8.61 |
0.8% |
|
Northern Borders |
7.6 |
0.7% |
|
Al Baha |
7.24 |
0.7% |
|
Total |
1,069.12 |
100% |
The number of tourism establishments advanced 8.7% YoY to 179,500.
Food and beverage service establishments accounted for the largest share, at about 115,700, or 64.5% of the total, followed by visitor accommodation establishments at 25,920.
|
Establishments by tourism activity |
||
|
Tourism activity |
No. of establishments |
Share of total |
|
Food & Beverage |
115.7 |
64.5% |
|
Visitor Accommodation |
25.92 |
14.4% |
|
Retail Trade of Country-Specific Tourism Characteristic Goods |
17.4 |
9.7% |
|
Sports & Recreational |
5.37 |
3% |
|
Land Passenger Transport |
4.48 |
2.5% |
|
Travel Agencies & Reservation Services |
3.74 |
2.1% |
|
Other Country-Specific Tourism Characteristic Services |
3.5 |
1.9% |
|
Transportation Renting |
1.66 |
0.9% |
|
Waterborne Transportation |
0.67 |
0.4% |
|
Rail Transportation |
0.44 |
0.2% |
|
Cultural Activities |
0.39 |
0.2% |
|
Air Transportation |
0.25 |
0.1% |
|
Total |
179,507 |
100% |
Comments {{getCommentCount()}}
Be the first to comment
رد{{comment.DisplayName}} على {{getCommenterName(comment.ParentThreadID)}}
{{comment.DisplayName}}

{{comment.ElapsedTime}}

Related News
| In-depth: Saudi hotels occupancy, ARR in Q1 2026 |

Comments Analysis: